📖 《把 AI 当助手——经济实证研究的诚信、方法与工具》双语网页版:每章中文部在前,English Edition 在后,内容与最新合订 PDF 一致。
第5章 · 测量、信效度与抽样
学习目标
完成本章后,你应当能够:
操作化链条:完成“构念 → 变量 → 指标”的降维链条,为每个核心变量写出可操作的测量方案
四类测量尺度:区分名义 / 顺序 / 等距 / 等比尺度,并为自己的问卷题项选型
Cronbach’s α:解释 α 的含义、判断量表信度是否达标、在 Stata 中跑出 α 并解读输出
三类效度:区分内容效度 / 构念效度 / 准则效度,说出各自的检验方法
抽样方案选择:为自己的调查选择抽样方法(概率 vs 非概率)并如实报告局限
三方向标注:【农】农村金融与微型金融 /【险】风险管理与保险 /【金】金融理论与政策
§5.1 概念化与操作化
操作化三步降维链条
以“金融素养”为例:
表 5.1 操作化三步降维链条。
L3|L3|L3
步骤 & 做什么 & 金融素养示例
概念化 & 给构念一个精确的理论定义 & Lusardi & Mitchell(2008):“理解经济金融概念并据此做出决策的能力”
操作化 & 选择可观测指标 & Lusardi 三问法:① 复利计算 ② 通货膨胀理解 ③ 风险分散认知
测量 & 确定量表形式与计分 & 每题答对 1 分、答错 0 分,总分 0-3\
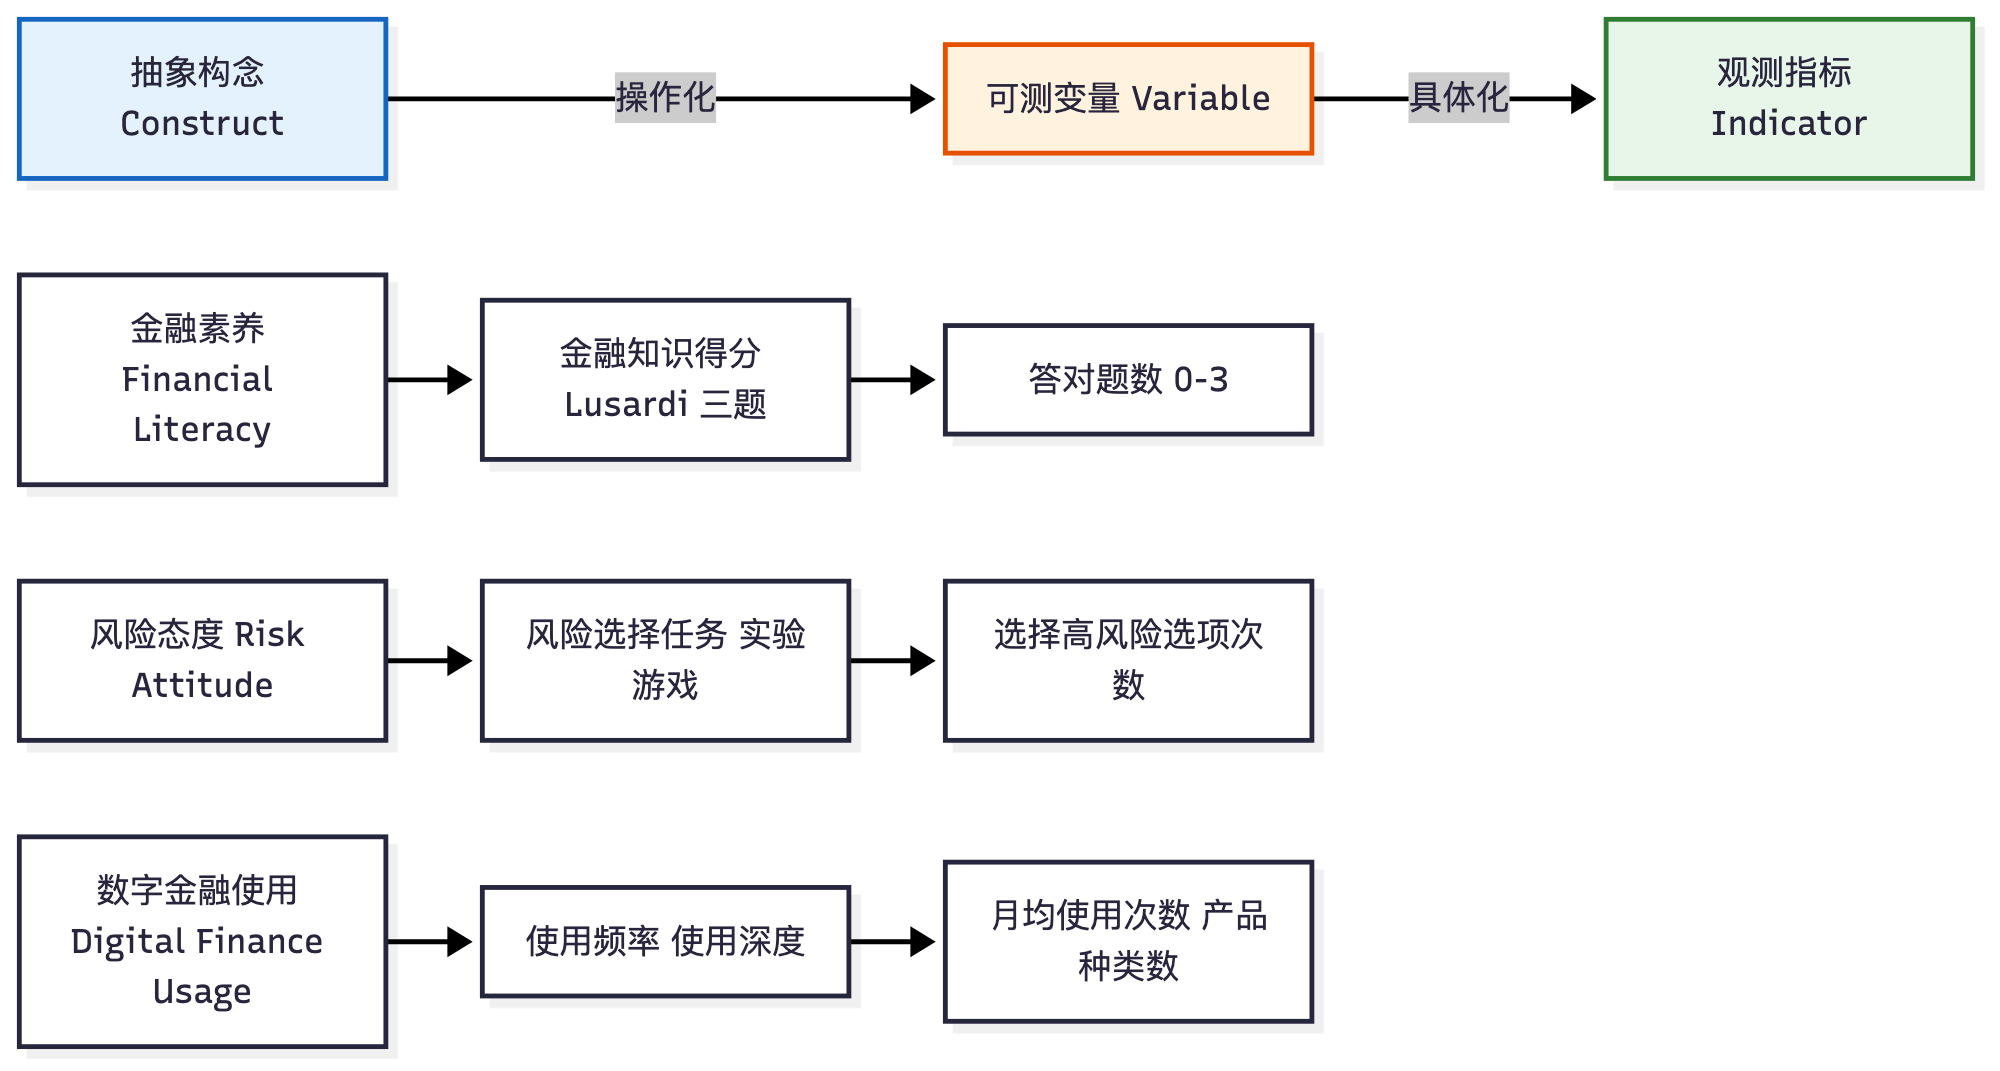
图 5.1 操作化三步降维链——从抽象概念到可测变量:翻译 → 赋值。
操作化双路径
表 5.2 操作化双路径。
L4|L4|L4|L4
路径 & 优势 & 劣势 & 适用情况
借用成熟量表 & 信效度有前人证据;节省时间;便于跨研究比较 & 可能不完全适配你的情境 & 绝大多数硕士论文的首选
自编量表 & 完全针对你的构念定义 & 需要完整的开发验证流程(§5.4) & 文献中确实没有可用量表时\
△ 诚信提示(S5.1):借用 ≠ 抄袭,但必须注明出处。论文里写“借鉴 Lusardi & Mitchell(2008)金融素养三问”,而不是自己默默用了不说。
金融构念操作化示例表
表 5.3 金融构念操作化示例表。
L5|L5|L5|L5|L5
构念 & 理论定义 & 操作化方式 & 尺度 & 来源文献
金融素养 & 理解金融概念并做出决策的能力 & Lusardi 三问得分(0-3) & 等距(加总) & Lusardi & Mitchell 2008
风险厌恶 & 面对不确定性时偏好确定性结果的倾向 & 风险资产占总资产比例 & 等比 & Cohn et al. 2015
数字普惠金融 & 数字技术驱动的金融服务可及性与使用深度 & 北京大学数字普惠金融指数(区县级) & 等距(标准化) & 郭峰等 2020
【险】投保意愿 & 农户对某类农业保险的购买倾向 & 李克特 5 点量表(5 题加总) & 等距 & 已有文献成熟量表
【农】金融排斥 & 农户获取正规金融服务的障碍程度 & 多维指数(地理 / 价格 / 条件 / 信息 / 营销) & 等距 & Demigüç-Kunt et al. 2008
【金】银行风险承担 & 银行承受损失以追求收益的倾向 & Z 值 = (ROA + CAR) / σ(ROA) & 等比 & Laeven & Levine 2009\
§5.2 测量尺度四类
四类尺度对照表
表 5.4 四类尺度对照表。
L4|L4|L4|L4
尺度类型 & 数学性质 & 可做的统计 & 金融举例
名义(Nominal) & 分类,无顺序;数值仅为标签 & 频数、众数、卡方检验 & 性别(男/女);是否有银行账户(0/1);银行类型(国有/股份制/城商/农商)
顺序(Ordinal) & 有顺序,间距不等 & 中位数、百分位、秩相关(Spearman) & 教育层次(小学/初中/高中/大学);满意度等级;信用评级(AAA→C)
等距(Interval) & 间距相等,无绝对零点 & 均值、标准差、t 检验、Pearson 相关、回归、方差分析 & 李克特 5 点量表得分;温度(℃);年份
等比(Ratio) & 有绝对零点,可算比值 & 所有统计方法 + 变异系数 + 比值比较 & 收入金额(元);贷款余额;ROA;年龄\
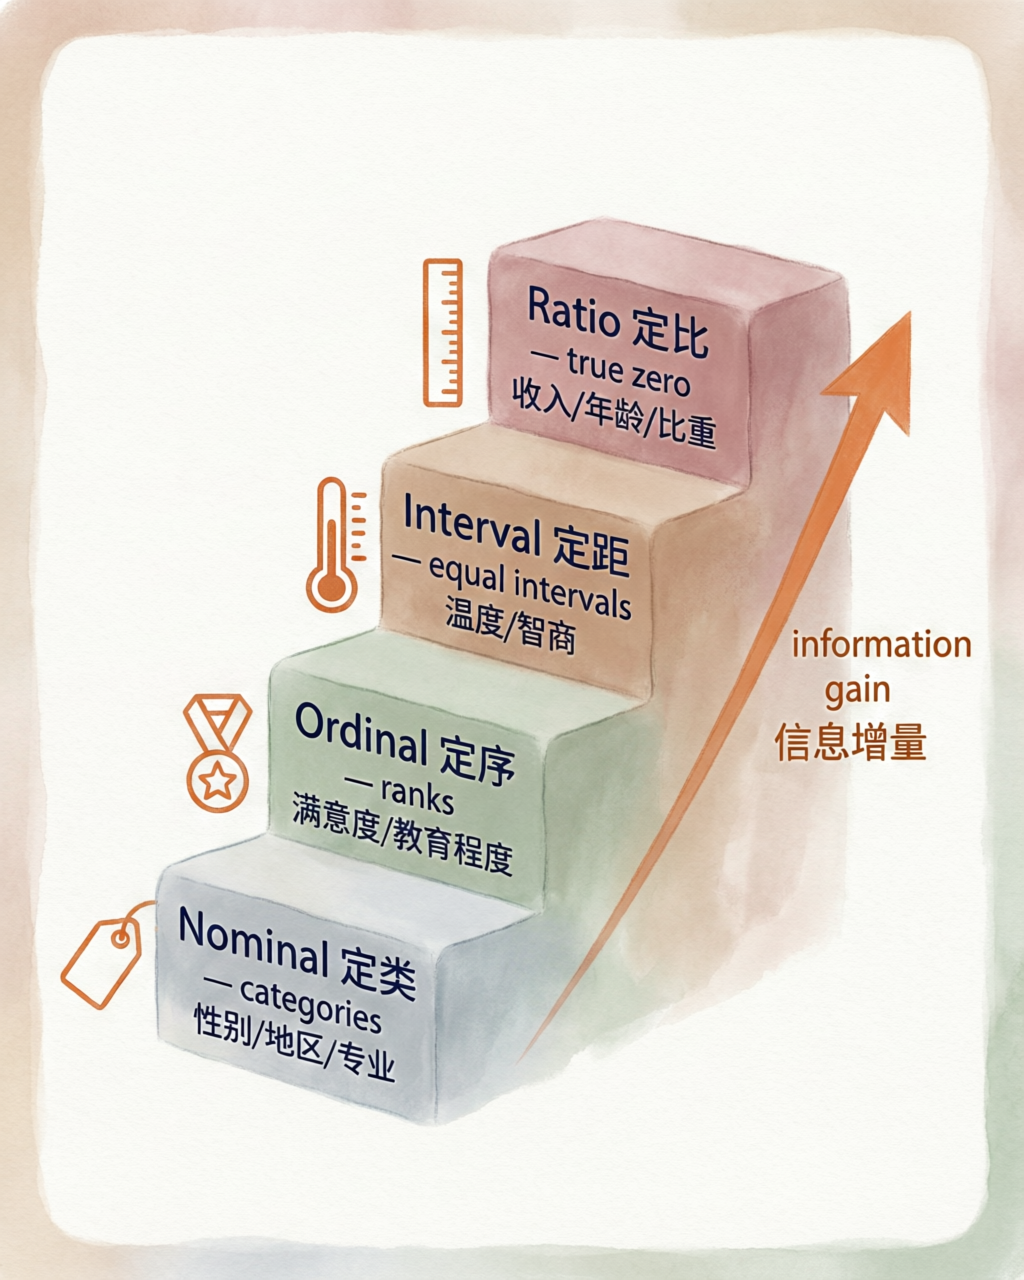
图 5.2 四类测量尺度阶梯——名义 → 顺序 → 等距 → 等比,信息增量逐级升高。
尺度与后续方法的对应关系
名义 -> 卡方检验 / 逻辑回归(第 9 章 §9.1)
顺序 -> 有序 Probit / 秩相关(第 9 章选讲)
等距/等比 -> OLS 回归 / 面板模型(第 9 章主力方法)
! 常见误区:李克特 5 点到底算什么尺度?
“李克特量表中各集合锚点之间并不是等距的,基于此,李克特量表还是顺序量表。”
学理立场:严格的顺序尺度。
实操惯例:社会科学(含金融学)普遍将其视为等距尺度处理——对多题项加总/取均值后,用参数统计方法分析。
你的做法:跟惯例走(审稿人不会因此拒稿),但论文里注明“本研究将李克特量表加总得分视为等距尺度处理”,这是学术诚实的体现。
快速判断练习
表 5.5 快速判断练习。
L3|L3|L3
变量 & 你的判断 & 正确答案
家庭年收入(元) & ___ & 等比(有绝对零点:0 元)
满意度五点量表加总分 & ___ & 等距(实操处理)/ 顺序(严格学理)
是否有贷款(是/否) & ___ & 名义
信用评级(AAA/AA/A/BBB…) & ___ & 顺序\
§5.3 李克特量表设计与指数构建
李克特量表(Likert Scale)基本结构
表 5.6 李克特量表(Likert Scale)基本结构。
L3|L3|L3
要素 & 标准 5 点 & 7 点版本
锚点 & 非常不同意(1)—不同意(2)—中立(3)—同意(4)—非常同意(5) & 增加“有些不同意/有些同意”,细微区分度更高
适用场景 & 大部分问卷(硕士论文首选) & 需要更高灵敏度时(如量表开发研究)
注意 & 取奇数——允许中立态度 & 受访者认知负担稍高\
题项撰写五条规范
一题一意:每题只测一个点。❌“我对银行的服务速度和态度都满意”→ 拆成两题
避免双重否定:❌“我不认为农户不需要贷款”→ ✅“农户有贷款需求”
避免诱导性:❌“大多数人都认为数字支付很方便,你同意吗?”→ ✅“数字支付很方便”
语句简洁:每题不超过 20 个字
避免绝对词:❌“从来/总是/绝不”→ 用“经常/有时/偶尔”
反向题设计(防应答偏差)
为什么需要反向题:受访者可能不认真读题,一路选“同意”。加入反向题后可以检测这种“ acquiescence bias”。
做法:正向题 + 反向题混合。例如测“金融服务满意度”:
表 5.7 反向题设计(防应答偏差)。
L3|L3|L3
题号 & 内容 & 方向
Q1 & 我对银行网点的服务态度感到满意 & 正向
Q2 & 银行的手续费水平让我感到不满 & 反向
Q3 & 手机银行的操作流程很方便 & 正向
Q4 & 我觉得去银行办理业务太浪费时间 & 反向\
计分:正向题 1→5 正常赋值;反向题需反转(1→5, 2→4, 3→3, 4→2, 5→1),然后加总。
指数构建
指数 ≠ 量表。两者区别:
量表:多个同质题项 → 加总/取均值 → 反映同一潜在构念
指数:多个异质维度 → 加权合成 → 反映构念的不同侧面
指数构建示例——数字普惠金融指数(郭峰等 2020):
数字普惠金融指数 = 覆盖广度 × w1 + 使用深度 × w2 + 数字化程度 × w3表 5.8 指数构建。
L3|L3|L3
维度 & 含义 & 代表性指标
覆盖广度 & 金融服务的可及性 & 支付宝账户覆盖率
使用深度 & 实际使用的频率与金额 & 支付/信贷/保险使用量
数字化程度 & 移动化/线上化水平 & 移动支付笔数占比\
加权三法:
表 5.9 方法 / 优点 / 缺点速查表。
L3|L3|L3
方法 & 优点 & 缺点
等权(各 1/3) & 简单透明 & 无法反映维度重要性差异
主成分分析(PCA) & 数据驱动 & 需大样本;结果不易解释
专家打分(德尔菲法) & 融入领域知识 & 主观性强\
[提示] 硕士论文实操建议:如果借用成熟指数(如北大指数),直接用原作者的加权方案,无需自己重新加权。
§5.4 量表开发四步与借用量表
自编量表开发四步法
+---------------------------------------------------------+
| Step 1: 文献回顾 -> 确定构念定义与维度                       |
| Step 2: 题项生成 -> 每维度 5-10 题(含反向题)               |
| Step 3: 专家评审 -> 内容效度(删改不合适题项)                |
| Step 4: 预测试   -> 信效度检验(删 α 低的题项)              |
+---------------------------------------------------------+
Step 1 · 文献回顾:
明确构念的理论定义(回指 §5.1 概念化)
找出前人用过的题项,建立“候选池”
判断维度:单维(如自尊)vs 多维(如金融素养 = 知识 + 行为 + 态度)
Step 2 · 题项生成:
每个维度生成 5-10 个候选题项
遵循 §5.3 的五条撰写规范
正反向题比例建议 3:1 或 2:1
AI 辅助:可以让 AI 生成初稿,但必须人工逐题筛选修改(见 §5.10 AI 辅助栏)
Step 3 · 专家评审:
邀请 3-5 位熟悉该构念的专家
逐题评判:该题是否属于这个构念?表述是否清晰?
计算内容效度指数(CVI):评判为“非常相关”的专家比例 ≥ 0.78
删除或修改不合格题项
Step 4 · 预测试:
小规模样本(30-50 人)试填
计算 Cronbach’s α(见 §5.5)
“删题后 α”:如果删某题后 α 显著上升 → 该题可能不属于这个构念 → 删除
最终保留 4-8 题的精简量表
借用量表注意事项(S5.1 核心要求)
表 5.10 借用量表注意事项(S5.1 核心要求)。
L3|L3|L3
要求 & 具体做法 & 论文写法示例
① 注明出处 & 标注原始开发者、发表年份、期刊 & “本文借鉴 Lusardi & Mitchell(2008)开发的金融素养三问量表”
② 报告原始信效度 & 原量表在原始样本中的 α 值 & “该量表在原始研究中 α = 0.72”
③ 报告自己样本的信效度 & 你的数据跑出来的 α & “在本研究样本中,α = 0.68”
④ 翻译版说明方法 & 如使用中文翻译版 & “采用回译法(先中→英,再由另一译者英→中,比对一致性)”\
三方向借用量表速查
表 5.11 三方向借用量表速查。
L4|L4|L4|L4
方向 & 常用量表 & 原始文献 & 题项数
【农】金融素养 & Lusardi 三问 & Lusardi & Mitchell 2008 & 3
【农】金融排斥 & Findex 问卷模块 & Demirgüç-Kunt et al. 2018 & 10+
【险】投保意愿 & 计划行为量表改编 & Ajzen 1991 + 国内农险文献 & 5-8
【金】风险偏好 & DOSPERT 量表 & Weber et al. 2002 & 30(可选子维度)\
§5.5 信度(Reliability)
三种信度类型
表 5.12 三种信度类型。
L5|L5|L5|L5|L5
类型 & 含义 & 检验方法 & 门槛值 & 适用场景
内部一致性信度 & 多题项是否测量同一构念 & Cronbach’s α & ≥ 0.7(探索性研究 ≥ 0.6) & 李克特量表最常用
折半信度 & 量表前后两半是否一致 & Spearman-Brown 校正 & ≥ 0.7 & 题项数较多时的替代检验
重测信度 & 间隔一段时间测同一人是否稳定 & 两次测量值的 Pearson r & ≥ 0.7 & 适用于跨时间稳定性要求高的构念\
Cronbach’s α 深入理解
公式(不要求推导,理解逻辑即可):
α = k/(k-1) × (1 - Σσ²
其中:
k = 题项数量
σ²
= 第 i 题的方差 σ²
= 总分的方差
直觉理解:如果每道题都在测同一个东西,那么各题的方差之和应该远小于总分的方差(因为总分中包含了“共同信号”的放大效应)。α 就是衡量这个比例的。
α 值的解读:
表 5.13 Cronbach’s α 深入理解。
L3|L3|L3
α 范围 & 判断 & 行动
< 0.6 & 信度不足 & 必须删题或重新设计
0.6 - 0.7 & 勉强可接受(探索性研究) & 报告并说明原因
0.7 - 0.9 & 良好 & 放心使用
> 0.95 & 可能冗余 & 检查是否有题项过于相似(措辞不同但意思完全一样)\
“删题后 α”的使用:如果删某题后 α 上升 → 该题可能在测别的东西 → 考虑删除。
Stata 实操
* 计算 Cronbach's α 并显示"删题后α"
alpha item1 item2 item3 item4 item5, item

* 输出解读:
*   Cronbach's alpha = 0.7856       <- 整体 α
*   item1  if dropped: 0.7623      <- 删 item1 后 α 下降 -> item1 有价值
*   item3  if dropped: 0.8102      <- 删 item3 后 α 上升 -> item3 可能有问题
不可靠测量的三大来源
观测者主观性:用观察法测“员工士气”——不同观察者结论不同
问题模糊:问“你的工资是多少”——月薪?年薪?含不含奖金?
受访者不熟悉:问农户“你对 LPR 改革的评价”——多数人答不上来
§5.6 效度(Validity)
三类效度
表 5.14 三类效度。
L4|L4|L4|L4
类型 & 核心问题 & 检验方法 & 金融举例
内容效度 & 题项是否覆盖了构念的全部维度? & 专家评审 / 文献对照 / CVI 指数 & “金融素养”三问是否覆盖了所有维度?(实际上只有知识维度,缺行为维度——内容效度有限)
构念效度 & 量表是否真正测量了理论构念? & 因子分析(EFA/CFA)/ 收敛-区分 & 5 个题项是否确实加载在同一因子上?
准则效度 & 量表得分与外部标准是否一致? & 与“金标准”的相关系数 & 自评金融素养得分 vs 实际投资表现(如资产配置合理性)\
构念效度的两个子维度
表 5.15 构念效度的两个子维度。
L3|L3|L3
子维度 & 含义 & 检验标准
收敛效度(Convergent) & 测同一构念的不同量表应高度相关 & 同因子载荷 ≥ 0.6;AVE ≥ 0.5
区分效度(Discriminant) & 测不同构念的量表应低相关 & 跨因子载荷 ≤ 0.3;√AVE > 构念间相关\
判定标准:
同一构念的各指标应在单个因子上具有 ≥ 0.6 的因子负荷
这些指标应在所有其他因子上具有 ≤ 0.3 的因子负荷
信度与效度的关系
信度是效度的必要非充分条件
-> 可靠不一定准确(秤每次都少 10 斤)
-> 准确一定可靠(不可能准确但不一致)实操含义:先检验信度(α),再检验效度(因子分析)。α 不达标的量表,效度检验毫无意义。
与第 4 章的区分
表 5.16 与第 4 章的区分。
L3|L3|L3
术语 & 含义 & 所在章
测量效度(本章) & 你的量表测到构念了吗? & 第 5 章
内部效度(第 4 章) & X 真的导致了 Y 吗? & 第 4 章 §4.2
外部效度(第 4 章) & 结论能推广吗? & 第 4 章 §4.2
统计结论效度 & 统计方法用对了吗? & 第 9 章\
△ 别在论文中把“内容效度”和“内部效度”搞混——前者说的是测量,后者说的是因果推断。
§5.7 抽样方法
抽样过程三步
定义总体:你要推断的对象是谁?(如“四川省所有种粮农户”)
选择抽样框:你能接触到的名单是什么?(如“某县农业局的农户登记册”)
确定抽样方法:从抽样框中怎么选?
△ 抽样框 ≠ 总体。抽样框有偏 → 结论推广受限(“从这样的样本中得出的推论可能不能推广回到总体”)。
概率抽样四式
表 5.17 概率抽样四式。
L4|L4|L4|L4
方法 & 原理 & 经济研究举例 & 优缺点
简单随机 & 总体中每个单元等概率被选 & 从 1000 家银行中随机抽 100 家 & ✅ 最理想、统计推断最干净;❌ 实操需要完整名单
系统抽样 & 排序后每隔 k 个选一个(k = N/n) & 按规模排序后每第 10 家选 1 家 & ✅ 简便;❌ 若存在周期性则有偏
分层抽样 & 先按特征分层,再层内随机 & 按东/中/西分层 → 省内随机选县 & ✅ 提高精度(层内同质);❌ 需要分层信息
整群抽样 & 随机选“群”→ 群内全查 & 随机选 5 个村 → 村内全部农户 & ✅ 省钱省力;❌ 精度低(群间差异大)\
非概率抽样四式
表 5.18 非概率抽样四式。
L3|L3|L3
方法 & 原理 & 适用场景
便利抽样 & 谁方便就选谁 & 预测试、探索性研究
判断抽样 & 研究者主观判断选“有代表性”的 & 专家访谈
滚雪球 & 受访者推荐下一个受访者 & 难以接触的群体(如网贷逾期农户)
配额抽样 & 按特征比例选,但层内非随机 & 市场调研\
△ 非概率抽样不能做统计推断(不能算置信区间、不能说“95%的概率……”)。但可以如实报告结果并讨论局限。
农户调查的现实选择
做农村金融调查,教科书式的“简单随机抽样”几乎不可能实现。现实中最常用的是:
多阶段分层抽样 + 村内便利
   v
省级分层(东/中/西或按经济水平)
   -> 县级随机选
      -> 乡镇随机选
         -> 村随机选
-> 村内:便利抽样(入户走访能接触到的农户)必须如实报告(S5.2):
“本文采用多阶段分层抽样,具体为……”
“村级层面的受访者选取受限于入户可及性,属于便利抽样,样本代表性受限”
这就是《中国农村观察》《金融研究》调研风格论文的基本功
抽样误差与样本量速算
“n ≈ 384”的来历:
在 95% 置信水平 + 5% 允许误差下,对于大规模总体的简单随机抽样:
n = Z² × p(1-p) / E²
其中 Z = 1.96(95% 置信),p = 0.5(最大方差假设),E = 0.05(允许误差)
n = 1.96² × 0.25 / 0.05² = 3.8416 × 0.25 / 0.0025 = 384.16 ≈ 384
样本量四大决定因素:
表 5.19 抽样误差与样本量速算。
L2|L2
因素 & 影响方向
总体方差(越大 → 需要越多样本) &
置信水平(99% 比 95% 需要更多) &
允许误差(越精确 → 越多样本) &
设计效应 deff(整群/分层 > 简单随机) &
实操建议:硕士论文问卷调查,样本量 ≥ 300 通常可接受;使用整群抽样时建议 × deff(通常 1.5-2.5),即 450-750 份。
§5.8 金融构念操作化案例
案例 1 · 金融素养(Lusardi 三问法)
来源:Lusardi, A. & Mitchell, O.S. (2008). “Planning and Financial Literacy: How Do Women Fare?” American Economic Review, 98(2), 413-417.
三道题:
表 5.20 案例 1 · 金融素养(Lusardi 三问法)。
L3|L3|L3
# & 题目 & 测什么
1 & 假设你有 100 元存款,年利率 2%,5 年后本息合计是多少?(>102 / =102 / <102) & 复利计算
2 & 假设年利率 1%,通胀率 2%,一年后你存款的购买力是?(增加 / 不变 / 减少) & 通胀理解
3 & “买一只股票通常比买一只基金风险更小”——对还是错? & 风险分散认知\
计分:答对 = 1,答错/不知道 = 0,总分 0-3。
α 值:原始研究 α = 0.72;中国样本 α 通常在 0.55-0.70(因为只有 3 题,α 受题数限制偏低是正常现象)。
跨文化验证:该量表已在全球 30+ 国家使用,包括中国(廖理等 2014;吴雨等 2017)。
[提示] 为什么只有 3 题就能发 AER?因为操作化精准——三题分别对应金融素养的三个核心维度。题不在多,在于对准构念定义。
案例 2 · 风险厌恶(三种操作化路径)
表 5.21 案例 2 · 风险厌恶(三种操作化路径)。
L5|L5|L5|L5|L5
方法 & 操作化 & 尺度 & 优势 & 局限
A. 客观行为 & 风险资产(股票 + 基金 + 理财)占总资产比例 & 等比 & 反映真实决策 & 受财富水平/市场周期影响
B. 主观自评 & “你认为自己承受风险的能力是?”(1-5 分) & 顺序→等距 & 简单快速 & 自评偏差(过度自信)
C. 实验博弈 & 多价格列表法(Holt & Laury 2002) & 等距 & 内部效度最高 & 成本高,农户理解门槛\
硕士论文推荐:方法 A(有现成数据如 CHFS)或方法 B(问卷中加一题)。方法 C 适合博士论文或实验经济学方向。
案例 3 · 数字普惠金融指数(北京大学)
来源:郭峰、王靖一、王芳、孔涛、张勋、程志云(2020).“测度中国数字普惠金融发展:指数编制与空间特征”.《经济学(季刊)》,19(4),1401-1418.
三维九指标结构:
表 5.22 案例 3 · 数字普惠金融指数(北京大学)。
L2|L2
维度 & 子指标举例
覆盖广度 & 支付宝账户覆盖率、每万人支付宝账户数
使用深度 & 支付/信贷/保险/投资/信用业务使用量
数字化程度 & 移动支付笔数占比、手机支付金额占比\
借用规范(S5.1):
论文中必须注明“本文数字普惠金融数据来源于郭峰等(2020)编制的北京大学数字普惠金融指数”
注明数据粒度:区县级(最低)/ 省级 / 城市级
原始 α 值或信效度证据:该指数用 PCA 加权,原文报告了 KMO 值和方差解释率
使用限制:
△ 该指数是区县级宏观数据,不能直接代表个体层面的数字金融使用
如果你的因变量是“农户收入”(个体层面),自变量用区县级指数 → 生态谬误风险(回指第 2 章 §2.2 分析单元错配)
解决方案:要么把分析单元提升到区县级,要么用问卷自测个体层面的数字金融使用
AI 辅助研究栏
1. AI 题项头脑风暴
场景:你要自编一个“农户数字金融素养”量表,但一时想不到好的题项。
提示词模板:
我正在开发一个测量"[构念名称]"的量表。
理论定义:[写出你 §5.1 的概念化定义]。
维度:[列出维度]。
请为每个维度生成 8-10 个李克特 5 点题项。
要求:一题一意、避免双重否定、语句不超过 20 字、含 2-3 个反向题。人工筛选:
AI 生成的题项是“候选池”,不是最终量表
你必须逐题对照操作化定义筛选:这个题真的在测你想测的东西吗?
删掉“看起来像但实际测的是别的东西”的题
最终交给专家评审(Step 3)
2. AI 信效度分析跟做
Stata 命令:
* 跑 α
alpha q1 q2 q3 q4 q5 q6, item

* 跑因子分析(构念效度)
factor q1-q6, pcf
rotate varimax
factor q1-q6, pcf mineigen(1)
让 AI 帮你解读:把 Stata 输出截图或文字贴给 AI,问:
“α = 0.72 达标了吗?删哪题能提升?”
“因子载荷矩阵中哪些题跨因子载荷 > 0.3?”
“收敛效度和区分效度是否达标?”
3. AI 抽样方案评审
做法:把你写好的 sampling_plan.md(本章产出物)贴给 AI,问:
请评审以下抽样方案:
1. 存在哪些潜在的抽样偏差?
2. 抽样框是否覆盖了目标总体?
3. 样本量是否足够?计算依据是什么?
4. 有什么改进建议?
△ AI 的建议只是参考——最终方案由你和导师决定。AI 不了解你调研地区的实际情况。
🛡 AI 诚信栏|S5.1 借用量表注明出处与信效度证据
必须做到:
✅ 不把借用量表说成自编(“本文参考 Lusardi & Mitchell(2008)开发的三问法”)
✅ 报告原始文献的 α 值(“原量表 α = 0.72”)
✅ 报告自己样本的 α 值(“本研究样本 α = 0.68”)
✅ 翻译版说明翻译方法(“采用回译法,由两位译者独立完成”)
绝对禁止:
❌ 直接用别人的量表但不引用来源(= 抄袭)
❌ 让 AI 生成量表题项后不筛选不验证就放进问卷
❌ 报告“α = 0.85”但实际根本没跑过
alpha命令(= 数据造假)
S5.2 抽样方案如实描述
必须做到:
✅ 非概率抽样就写“便利抽样”或“滚雪球抽样”
✅ 多阶段分层中的“村内便利”环节如实标注
✅ 讨论局限性时承认“样本代表性受限,结论推广需谨慎”
绝对禁止:
❌ 把便利抽样写成“随机抽样”(最常见的诚信问题之一)
❌ 隐瞒抽样框与总体的偏差
❌ 事后追溯样本还声称是“前瞻性设计”
正面示范(摘自《中国农村观察》论文风格):
“本文数据来源于课题组 2025 年 7-8 月在四川省 XX 市 XX 县开展的入户调查。调查采用多阶段分层抽样:第一阶段按经济发展水平将全省划分为高/中/低三层,每层随机抽取 1 个样本县;第二阶段在每个样本县随机抽取 2 个乡镇;第三阶段在每个乡镇随机抽取 2 个行政村;第四阶段在样本村内采用便利抽样,对可接触到的农户进行入户问卷调查。共发放问卷 480 份,回收有效问卷 452 份,有效率 94.2%。需指出,村级层面的便利抽样可能影响样本代表性,后续研究可扩大抽样范围进行验证。”
本章产出物
产出物 1:measurement_plan.md(构念操作化表)
# 测量方案(Measurement Plan)

## 构念操作化表

| 构念 | 理论定义 | 题项/指标 | 尺度类型 | 信效度计划 | 来源文献 |
|---|---|---|---|---|---|
| (填你的核心自变量) | | | | α ≥ 0.7;CFA 载荷 > 0.6 | |
| (填你的核心因变量) | | | | | |
| (控制变量 1) | | | | | |

## 量表来源声明
- [ ] 借用量表:已注明出处、原始 α、本样本 α
- [ ] 自编量表:已完成文献回顾->题项生成->专家评审->预测试
- [ ] 翻译量表:已说明翻译方法

## 反向题清单
| 题号 | 内容 | 反转方法 |
|---|---|---|
| | | 6-x 或重新编码 |
产出物 2:sampling_plan.md(抽样方案一页纸)
# 抽样方案(Sampling Plan)

| 项目 | 内容 |
|---|---|
| 目标总体 | (如:四川省种粮农户) |
| 抽样框 | (如:XX 县农业农村局农户登记册) |
| 抽样方法 | (如:三阶段分层 + 村内便利) |
| 样本量 | (如:450 份) |
| 样本量计算依据 | (如:n = Z²p(1-p)/E² × deff = 384 × 1.5 ≈ 576,实发 600) |
| 实施步骤 | 1. … 2. … 3. … |
| 预期偏差与局限 | (如:村内便利可能遗漏外出务工户) |
| S5.2 合规声明 | "本方案如实描述实际抽样过程,不以便利冒充随机" |
English Edition
Chapter 5 · Measurement, Reliability and Validity, and Sampling
Learning Objectives
After completing this chapter, you should be able to:
The operationalization chain: complete the dimension-reducing chain “construct → variable → indicator” and write an operational measurement plan for each core variable
The four measurement scales: distinguish nominal / ordinal / interval / ratio scales and choose the right type for your questionnaire items
Cronbach’s alpha: interpret what α means, judge whether a scale’s reliability meets the threshold, run α in Stata and read the output
The three types of validity: distinguish content / construct / criterion validity and state how each is tested
Choosing a sampling plan: select a sampling method for your survey (probability vs. non-probability) and report its limitations honestly
Three-track tagging: 【Agri】rural finance and microfinance / 【Ins】risk management and insurance / 【Fin】finance theory and policy
§5.1 Conceptualization and Operationalization
The Three-Step Dimension-Reducing Chain
Take “financial literacy” as the example:
Table 5.1 The three-step operationalization chain.
L3|L3|L3
Step & What you do & Financial-literacy example
Conceptualization & Give the construct a precise theoretical definition & Lusardi & Mitchell (2008): “the ability to understand economic and financial concepts and make decisions accordingly”
Operationalization & Choose observable indicators & The Lusardi three questions: (1) compound interest (2) inflation (3) risk diversification
Measurement & Fix the scale form and scoring & 1 point per correct answer, 0 otherwise; total 0–3\
Figure 5.1 The three-step operationalization chain—from abstract concept to measurable variable: translate, then assign values.
Two Paths of Operationalization
Table 5.2 Two paths of operationalization.
L4|L4|L4|L4
Path & Advantages & Disadvantages & When to use
Borrow a mature scale & Validity and reliability already evidenced; saves time; enables cross-study comparison & May not fit your context perfectly & The first choice for the vast majority of master’s theses
Develop your own scale & Perfectly matches your construct definition & Requires the full development-validation process (§5.4) & When the literature truly offers no usable scale\
△ Integrity note (S5.1): borrowing is not plagiarism, but the source must be cited. Write “we adapt the financial-literacy three questions of Lusardi & Mitchell (2008)”—do not silently use it without saying so.
Worked Operationalization Table for Financial Constructs
Table 5.3 Worked operationalization examples for financial constructs.
L5|L5|L5|L5|L5
Construct & Theoretical definition & Operationalization & Scale & Source
Financial literacy & The ability to understand financial concepts and make decisions & Lusardi three-question score (0–3) & Interval (sum) & Lusardi & Mitchell 2008
Risk aversion & The preference for certain outcomes under uncertainty & Risky assets as a share of total assets & Ratio & Cohn et al. 2015
Digital inclusive finance & Access to and depth of use of digitally driven financial services & Peking University Digital Financial Inclusion Index (county level) & Interval (standardized) & Guo et al. 2020
【Ins】Willingness to insure & Farmers’ propensity to buy a given agricultural insurance & 5-item Likert scale (sum of 5) & Interval & Mature scales in the literature
【Agri】Financial exclusion & The degree of farmers’ barriers to formal financial services & Multidimensional index (geographic / price / condition / information / marketing) & Interval & Demirgüç-Kunt et al. 2008
【Fin】Bank risk-taking & A bank’s propensity to bear losses in pursuit of returns & Z-score = (ROA + CAR) / σ(ROA) & Ratio & Laeven & Levine 2009\
§5.2 The Four Measurement Scales
The Four Scales Compared
Table 5.4 The four measurement scales.
L4|L4|L4|L4
Scale & Mathematical properties & Permitted statistics & Finance examples
Nominal & Categories, no order; numbers are mere labels & Frequencies, mode, chi-square & Gender (male/female); has a bank account (0/1); bank type (state-owned / joint-stock / city commercial / rural commercial)
Ordinal & Ordered, unequal spacing & Median, percentiles, rank correlation (Spearman) & Education level (primary / junior / senior / university); satisfaction grades; credit ratings (AAA→C)
Interval & Equal spacing, no absolute zero & Mean, SD, t-tests, Pearson correlation, regression, ANOVA & Likert 5-point scores; temperature (℃); year
Ratio & Absolute zero; ratios meaningful & All methods + coefficient of variation + ratio comparison & Income (yuan); loan balance; ROA; age\
Figure 5.2 The ladder of the four scales—nominal → ordinal → interval → ratio; information content rises at each step.
Matching Scales to Later Methods
Nominal      -> chi-square / logistic regression (Ch. 9, §9.1)
Ordinal      -> ordered Probit / rank correlation (Ch. 9, optional)
Interval/ratio -> OLS / panel models (the workhorses of Ch. 9)
! Common Pitfall: What Scale Is a Likert 1–5 Item, Really?
“The anchors of a Likert scale are not equally spaced; on these grounds a Likert scale is an ordinal scale.”
The scholarly position: strictly, an ordinal scale.
The practical convention: the social sciences (finance included) routinely treat summed Likert scores as interval—aggregating multiple items and applying parametric methods.
What you should do: follow the convention (reviewers will not reject you for it), but state in the paper that “this study treats summed Likert-scale scores as interval data”—a mark of academic honesty.
Quick Judgment Exercise
Table 5.5 Quick judgment exercise.
L3|L3|L3
Variable & Your call & Correct answer
Household annual income (yuan) & ___ & Ratio (absolute zero: 0 yuan)
Summed 5-point satisfaction score & ___ & Interval (by convention) / Ordinal (strictly)
Has a loan (yes/no) & ___ & Nominal
Credit rating (AAA/AA/A/BBB…) & ___ & Ordinal\
§5.3 Likert Scale Design and Index Construction
Basic Structure of the Likert Scale
Table 5.6 Basic structure of the Likert scale.
L3|L3|L3
Element & Standard 5-point & 7-point version
Anchors & Strongly disagree(1)–disagree(2)–neutral(3)–agree(4)–strongly agree(5) & Adds “somewhat disagree / somewhat agree”; finer discrimination
Best for & Most questionnaires (the master’s-thesis default) & When higher sensitivity is needed (e.g., scale-development studies)
Note & Odd number—allows a neutral stance & Slightly higher cognitive load for respondents\
Five Rules for Writing Items
One idea per item: each item measures one thing. ❌ “I am satisfied with both the speed and the courtesy of the bank’s service” → split into two items
Avoid double negatives: ❌ “I don’t think farmers don’t need loans” → ✅ “Farmers have loan demand”
Avoid leading wording: ❌ “Most people think digital payment is convenient—do you agree?” → ✅ “Digital payment is convenient”
Keep sentences short: no more than 20 characters per item
Avoid absolutes: ❌ “never / always / absolutely” → use “often / sometimes / occasionally”
Reverse-Coded Items (Guarding Against Response Bias)
Why reverse items matter: respondents may stop reading carefully and agree all the way down. Reverse-coded items detect this “acquiescence bias”.
The method: mix positively and negatively worded items. For example, measuring “satisfaction with financial services”:
Table 5.7 Reverse-coded item design.
L3|L3|L3
Item & Content & Direction
Q1 & I am satisfied with the service attitude at bank branches & Positive
Q2 & The bank’s fee levels leave me dissatisfied & Reverse
Q3 & The mobile banking workflow is convenient & Positive
Q4 & I feel that going to the bank wastes too much time & Reverse\
Scoring: positive items are coded 1→5 as usual; reverse items must be flipped (1→5, 2→4, 3→3, 4→2, 5→1) before summing.
Index Construction
An index is not a scale. The distinction:
Scale: multiple homogeneous items → summed/averaged → reflecting one latent construct
Index: multiple heterogeneous dimensions → weighted combination → reflecting different facets of the construct
An index example—the digital financial inclusion index (Guo et al. 2020):
Digital financial inclusion index = coverage breadth x w1 + usage depth x w2 + digitization level x w3Table 5.8 Index construction.
L3|L3|L3
Dimension & Meaning & Representative indicators
Coverage breadth & Accessibility of financial services & Alipay account coverage rate
Usage depth & Frequency and amounts of actual use & Payment / credit / insurance usage volumes
Digitization level & Degree of mobile / online migration & Share of mobile-payment transactions\
Three weighting methods:
Table 5.9 Method / advantage / drawback.
L3|L3|L3
Method & Advantage & Drawback
Equal weights (1/3 each) & Simple and transparent & Ignores differences in dimensional importance
Principal component analysis (PCA) & Data-driven & Needs large samples; results harder to interpret
Expert scoring (Delphi) & Incorporates domain knowledge & Highly subjective\
[Tip] Practical advice for master’s theses: if you borrow a mature index (e.g., the PKU index), just use the original authors’ weighting scheme—do not re-weight it yourself.
§5.4 The Four Steps of Scale Development and Borrowed Scales
The Four-Step Method for Developing Your Own Scale
+---------------------------------------------------------+
| Step 1: Literature review -> fix the construct definition |
|         and dimensions                                    |
| Step 2: Item generation -> 5-10 items per dimension       |
|         (with reverse items)                              |
| Step 3: Expert review -> content validity (revise or      |
|         drop unsuitable items)                            |
| Step 4: Pretest -> reliability & validity tests (drop     |
|         items with low alpha)                             |
+---------------------------------------------------------+
Step 1 · Literature review:
Fix the construct’s theoretical definition (back to §5.1 conceptualization)
Collect items used in prior work into a “candidate pool”
Decide the dimensionality: unidimensional (e.g., self-esteem) vs. multidimensional (e.g., financial literacy = knowledge + behavior + attitude)
Step 2 · Item generation:
Generate 5–10 candidate items per dimension
Follow the five wording rules of §5.3
A positive-to-reverse ratio of 3:1 or 2:1 is recommended
AI assistance: you may have the AI draft candidates, but you must screen and revise every item yourself (see the §5.10 AI corner)
Step 3 · Expert review:
Invite 3–5 experts familiar with the construct
Have them judge each item: does it belong to this construct? Is the wording clear?
Compute the content validity index (CVI): the share of experts rating “highly relevant” should be
0.78 Delete or revise failing items
Step 4 · Pretest:
Trial completion with a small sample (30–50 people)
Compute Cronbach’s α (see §5.5)
“Alpha if deleted”: if dropping an item raises α substantially → it may not belong to the construct → drop it
Keep a streamlined scale of 4–8 items at the end
Checklist for Borrowed Scales (Core Requirement S5.1)
Table 5.10 Checklist for borrowed scales (S5.1).
L3|L3|L3
Requirement & What you do & How to write it in the paper
(1) Cite the source & Note the original developer, year, journal & “We adapt the financial-literacy three questions developed by Lusardi & Mitchell (2008)”
(2) Report the original reliability & The original scale’s α in its original sample & “In the original study the scale’s α = 0.72”
(3) Report reliability in your sample & The α from your own data & “In our sample, α = 0.68”
(4) Describe translation method & If you use a translated version & “We used back-translation (Chinese→English, then a second translator English→Chinese, reconciling differences)”\
Quick Reference: Commonly Borrowed Scales by Track
Table 5.11 Commonly borrowed scales by track.
L4|L4|L4|L4
Track & Common scale & Original source & Items
【Agri】Financial literacy & Lusardi three questions & Lusardi & Mitchell 2008 & 3
【Agri】Financial exclusion & Findex questionnaire module & Demirgüç-Kunt et al. 2018 & 10+
【Ins】Willingness to insure & Adapted theory-of-planned-behavior scale & Ajzen 1991 + domestic agricultural-insurance literature & 5–8
【Fin】Risk preference & DOSPERT & Weber et al. 2002 & 30 (sub-scales optional)\
§5.5 Reliability
Three Types of Reliability
Table 5.12 Three types of reliability.
L5|L5|L5|L5|L5
Type & Meaning & Test & Threshold & Best for
Internal consistency & Do the items measure the same construct? & Cronbach’s α &
Split-half & Are the two halves of the scale consistent? & Spearman–Brown correction &
Test–retest & Is the same person’s score stable over time? & Pearson r between two waves &
Understanding Cronbach’s Alpha
Formula (no derivation required; just grasp the logic):
α = k/(k-1) × (1 -
where:
k = number of items
= variance of item i = variance of the total score
Intuition: if every item measures the same thing, the sum of the items’ variances should be far smaller than the variance of the total (the total amplifies the “common signal”). α measures exactly this ratio.
Reading α values:
Table 5.13 Reading Cronbach’s alpha.
L3|L3|L3
α range & Verdict & Action
0.6–0.7 & Barely acceptable (exploratory) & Report and explain
0.7–0.9 & Good & Use with confidence
Using “alpha if deleted”: if dropping an item raises α → it may be measuring something else → consider dropping it.
Stata in Practice
* Compute Cronbach's alpha and show "alpha if item deleted"
alpha item1 item2 item3 item4 item5, item

* Reading the output:
*   Cronbach's alpha = 0.7856       <- overall alpha
*   item1  if dropped: 0.7623      <- alpha falls without item1
*                                     -> item1 is valuable
*   item3  if dropped: 0.8102      <- alpha rises without item3
*                                     -> item3 may be problematic
Three Sources of Unreliable Measurement
Observer subjectivity: measuring “employee morale” by observation—different observers reach different conclusions
Ambiguous questions: asking “what is your salary”—monthly? annual? including bonuses?
Unfamiliar respondents: asking farmers to “evaluate the LPR reform”—most cannot answer
§5.6 Validity
The Three Types of Validity
Table 5.14 The three types of validity.
L4|L4|L4|L4
Type & Core question & How to test & Finance example
Content validity & Do the items cover all dimensions of the construct? & Expert review / literature mapping / CVI & Do the three financial-literacy questions cover all dimensions? (In fact they cover only knowledge, not behavior—limited content validity)
Construct validity & Does the scale truly measure the theoretical construct? & Factor analysis (EFA/CFA) / convergent-discriminant & Do the 5 items really load on one factor?
Criterion validity & Does the scale score agree with an external standard? & Correlation with a “gold standard” & Self-rated financial literacy vs. actual investment performance (e.g., quality of asset allocation)\
The Two Sub-dimensions of Construct Validity
Table 5.15 The two sub-dimensions of construct validity.
L3|L3|L3
Sub-dimension & Meaning & Test criteria
Convergent validity & Scales measuring the same construct should correlate highly & Within-factor loadings ≥ 0.6; AVE ≥ 0.5
Discriminant validity & Scales measuring different constructs should correlate lowly & Cross-factor loadings ≤ 0.3;
Decision rules:
Indicators of the same construct should load ≥ 0.6 on a single factor
The same indicators should load ≤ 0.3 on every other factor
Reliability vs. Validity
Reliability is necessary but not sufficient for validity
-> reliable does not mean accurate (a scale that always reads 10 jin light)
-> accurate implies reliable (nothing can be accurate yet inconsistent)
Practical implication: test reliability first (α), then validity (factor analysis). For a scale with inadequate α, validity testing is meaningless.
Distinguishing from Chapter 4
Table 5.16 Distinguishing measurement validity from Chapter 4 concepts.
L3|L3|L3
Term & Meaning & Where
Measurement validity (this chapter) & Does your scale capture the construct? & Ch. 5
Internal validity (Ch. 4) & Does X truly cause Y? & Ch. 4, §4.2
External validity (Ch. 4) & Can the findings generalize? & Ch. 4, §4.2
Statistical conclusion validity & Are the statistical methods used correctly? & Ch. 9\
△ Do not confuse “content validity” with “internal validity” in your thesis—the former is about measurement, the latter about causal inference.
§5.7 Sampling Methods
The Three Steps of Sampling
Define the population: who do you want to infer about? (e.g., “all grain-growing households in Sichuan Province”)
Choose the sampling frame: what list can you actually reach? (e.g., “the county agricultural bureau’s register of farming households”)
Choose the sampling method: how do you select from the frame?
△ The sampling frame is not the population. A biased frame limits generalization—“inferences drawn from such a sample may not generalize back to the population.”
Four Probability Sampling Methods
Table 5.17 The four probability sampling methods.
L4|L4|L4|L4
Method & Principle & Economics example & Pros and cons
Simple random & Every unit has an equal chance of selection & Randomly pick 100 of 1,000 banks & ✅ ideal, cleanest inference; ❌ needs a complete list
Systematic & Sort, then take every
Stratified & Stratify by traits, then randomize within strata & Stratify east/central/west → random counties within strata & ✅ more precise (homogeneous strata); ❌ needs stratum information
Cluster & Randomly pick “clusters” → survey all within & Randomly pick 5 villages → survey all households & ✅ cheap and fast; ❌ less precise (between-cluster variance)\
Four Non-probability Sampling Methods
Table 5.18 The four non-probability sampling methods.
L3|L3|L3
Method & Principle & Typical use
Convenience & Take whoever is easy to reach & Pretests, exploratory studies
Judgmental & The researcher hand-picks “representative” cases & Expert interviews
Snowball & Respondents refer the next respondent & Hard-to-reach groups (e.g., farmers overdue on online loans)
Quota & Proportional by traits, but non-random within strata & Market research\
△ Non-probability samples do not support statistical inference (no confidence intervals, no “with 95% probability…”). But you may report results honestly and discuss limitations.
The Realistic Choice for Farm Household Surveys
In rural finance fieldwork, textbook-style “simple random sampling” is nearly impossible. The most common real-world design:
Multi-stage stratified sampling + within-village convenience
   |
Provincial stratification (east/central/west or by economic level)
   -> random selection of counties
      -> random selection of townships
         -> random selection of villages
            -> within village: convenience sampling
               (households reachable by door-to-door visits)
What you must report honestly (S5.2):
“This study uses multi-stage stratified sampling, specifically…”
“Respondent selection at the village level was constrained by accessibility and constitutes convenience sampling, limiting sample representativeness”
This is the basic craft of survey-style papers in Chinese Rural Observations and Journal of Financial Research
Sampling Error and Quick Sample-Size Arithmetic
Where “n ≈ 384” comes from:
At the 95% confidence level with a 5% margin of error, for simple random sampling from a large population:
n = Z
where Z = 1.96 (95% confidence), p = 0.5 (maximum-variance assumption), E = 0.05 (margin of error):
n = 1.96
The four determinants of sample size:
Table 5.19 Determinants of sample size.
L2|L2
Factor & Direction of effect
Population variance (larger → more sample needed) &
Confidence level (99% needs more than 95%) &
Margin of error (tighter → more sample) &
Design effect deff (cluster/stratified
Practical advice: for a master’s-thesis questionnaire survey, n ≥ 300 is usually acceptable; with cluster sampling multiply by deff (typically 1.5–2.5), i.e., 450–750 questionnaires.
§5.8 Worked Cases: Operationalizing Financial Constructs
Case 1 · Financial Literacy (The Lusardi Three Questions)
Source: Lusardi, A. & Mitchell, O.S. (2008). “Planning and Financial Literacy: How Do Women Fare?” American Economic Review, 98(2), 413–417.
The three questions:
Table 5.20 Case 1 · the Lusardi three questions.
L3|L3|L3
# & Question & What it measures
1 & Suppose you have 100 yuan in savings at 2% annual interest: after 5 years, is the balance more than, exactly, or less than 102? & Compound interest
2 & At 1% interest with 2% inflation, does your savings buy more, the same, or less in a year? & Inflation
3 & “Buying a single stock usually carries less risk than buying a mutual fund”—true or false? & Risk diversification\
Scoring: correct = 1, wrong/don’t know = 0; total 0–3.
The α value: α = 0.72 in the original study; Chinese samples typically show 0.55–0.70 (with only 3 items, a lower α is normal—it is capped by item count).
Cross-cultural validation: the scale has been used in 30+ countries, including China (Liao et al. 2014; Wu et al. 2017).
[Takeaway] Why did only three questions make the AER? Because the operationalization is precise—each question maps to one core dimension of financial literacy. It is not the number of items but their alignment with the construct definition.
Case 2 · Risk Aversion (Three Operationalization Paths)
Table 5.21 Case 2 · three paths to measuring risk aversion.
L5|L5|L5|L5|L5
Path & Operationalization & Scale & Strength & Limitation
A. Observed behavior & Risky assets (stocks + funds + wealth products) as share of total assets & Ratio & Reflects real decisions & Affected by wealth level / market cycles
B. Self-rating & “How would you rate your own risk tolerance?” (1–5) & Ordinal → interval & Quick and easy & Self-assessment bias (overconfidence)
C. Experimental game & Multiple price list (Holt & Laury 2002) & Interval & Highest internal validity & Costly; comprehension burden for farmers\
Recommendation for a master’s thesis: Path A (ready-made data such as CHFS) or Path B (one extra questionnaire item). Path C suits doctoral work or experimental economics.
Case 3 · The Peking University Digital Financial Inclusion Index
Source: Guo Feng, Wang Jingyi, Wang Fang, Kong Tao, Zhang Xun, Cheng Zhiyun (2020). “Measuring China’s Digital Financial Inclusion: Index Compilation and Spatial Characteristics.” China Economic Quarterly, 19(4), 1401–1418.
Three dimensions, nine indicators:
Table 5.22 Case 3 · the PKU digital financial inclusion index.
L2|L2
Dimension & Example sub-indicators
Coverage breadth & Alipay account coverage; Alipay accounts per 10,000 people
Depth of use & Usage of payments / credit / insurance / investment / credit reporting
Digitization level & Share of mobile-payment transactions; share of mobile-payment value\
Borrowing protocol (S5.1):
The thesis must state “the digital finance data come from the Peking University Digital Financial Inclusion Index compiled by Guo et al. (2020)”
State the data granularity: county (finest) / provincial / city level
Original reliability evidence: the index is PCA-weighted; the original paper reports KMO values and variance explained
Usage restrictions:
△ The index is county-level macro data; it cannot directly represent individual digital finance use
If your dependent variable is “household income” (individual level) and the independent variable is a county-level index → ecological fallacy risk (see Ch. 2, §2.2, mismatched units of analysis)
Fix: either raise the unit of analysis to the county level, or measure individual digital finance use with your own questionnaire items
AI-Assisted Research Corner
1. AI Item Brainstorming
Scenario: you are developing a “farmers’ digital financial literacy” scale and cannot think of good items.
Prompt template:
I am developing a scale to measure "[construct name]".
Theoretical definition: [your conceptual definition from Sec. 5.1].
Dimensions: [list the dimensions].
Please generate 8-10 Likert 5-point items per dimension.
Requirements: one idea per item, no double negatives,
no more than 20 words per item, and include 2-3 reverse items.
Human screening:
AI-generated items are a “candidate pool”, not a final scale
You must check each item against the operational definition: does it really measure what you intend?
Drop items that “look right but actually measure something else”
Then send survivors to expert review (Step 3)
2. AI-Assisted Reliability and Validity Analysis
Stata commands:
* Run alpha
alpha q1 q2 q3 q4 q5 q6, item

* Run factor analysis (construct validity)
factor q1-q6, pcf
rotate varimax
factor q1-q6, pcf mineigen(1)
Let the AI interpret: paste the Stata output (screenshot or text) and ask:
“Is α = 0.72 acceptable? Which item should I drop to raise it?”
“Which items in the loading matrix have cross-loadings
0.3?” “Are convergent and discriminant validity satisfied?”
3. AI Review of the Sampling Plan
Method: paste your sampling_plan.md (this chapter’s deliverable) to the AI and ask:
Please review the following sampling plan:
1. What potential sampling biases exist?
2. Does the sampling frame cover the target population?
3. Is the sample size sufficient? On what calculation?
4. What improvements do you suggest?
△ AI suggestions are references only—the final plan is decided by you and your supervisor. The AI does not know the realities of your field site.
🛡 AI Integrity|S5.1 Cite Sources and Reliability Evidence for Borrowed Scales
You must:
✅ Never present a borrowed scale as self-developed (“this study adapts the three questions developed by Lusardi & Mitchell (2008)”)
✅ Report the original study’s α (“α = 0.72 in the original scale”)
✅ Report your own sample’s α (“α = 0.68 in this study’s sample”)
✅ Describe the translation method for translated versions (“back-translation performed independently by two translators”)
Absolutely forbidden:
❌ Using someone else’s scale without citing the source (= plagiarism)
❌ Putting AI-generated items into the questionnaire without screening or validation
❌ Reporting “α = 0.85” when you never actually ran
alpha(= data fabrication)
S5.2 Describe the Sampling Plan Honestly
You must:
✅ Call a non-probability sample “convenience sampling” or “snowball sampling”
✅ Flag the “within-village convenience” stage of multi-stage stratified designs honestly
✅ Acknowledge in limitations that “sample representativeness is limited; generalization requires caution”
Absolutely forbidden:
❌ Writing up convenience sampling as “random sampling” (one of the most common integrity problems)
❌ Concealing the gap between the sampling frame and the population
❌ Retrospectively assembled samples passed off as “prospective designs”
A positive example (in the style of Chinese Rural Observations):
“Our data come from a household survey conducted by the research team in XX County, XX City, Sichuan Province, in July–August 2025. The survey used multi-stage stratified sampling: stage one stratified the province into high/middle/low economic-development tiers and randomly selected one sample county per tier; stage two randomly selected two townships per sample county; stage three randomly selected two administrative villages per township; stage four used convenience sampling within sample villages, administering door-to-door questionnaires to reachable households. We distributed 480 questionnaires and recovered 452 valid ones, a valid-response rate of 94.2%. We note that village-level convenience sampling may limit sample representativeness; future research should widen the sampling scope for verification.”
Chapter Deliverables
Deliverable 1: measurement_plan.md (Operationalization Table)
# Measurement Plan

## Construct operationalization table

| Construct | Theoretical definition | Items/indicators | Scale type | Rel./validity plan | Source |
|---|---|---|---|---|---|
| (your key independent variable) |  |  |  | alpha >= 0.7; CFA loading > 0.6 |  |
| (your key dependent variable) |  |  |  |  |  |
| (control variable 1) |  |  |  |  |  |

## Scale source declaration
- [ ] Borrowed scale: source, original alpha, own-sample alpha all cited
- [ ] Self-developed scale: literature review -> item generation ->
      expert review -> pilot test all completed
- [ ] Translated scale: translation method described

## Reverse-coded item list
| Item | Content | How to reverse |
|---|---|---|
|  |  | 6-x or recode |
Deliverable 2: sampling_plan.md (One-Page Sampling Plan)
# Sampling Plan

| Item | Content |
|---|---|
| Target population | (e.g., grain-growing households in Sichuan) |
| Sampling frame | (e.g., county agriculture bureau's household register) |
| Sampling method | (e.g., three-stage stratified + within-village convenience) |
| Sample size | (e.g., 450 questionnaires) |
| Size justification | (e.g., n = Z^2 p(1-p)/E^2 x deff = 384 x 1.5 ~ 576; 600 distributed) |
| Implementation steps | 1. ... 2. ... 3. ... |
| Expected bias and limits | (e.g., within-village convenience may miss migrant households) |
| S5.2 compliance statement | "This plan describes the actual sampling process honestly;
  convenience is never passed off as random" |