📖 《把 AI 当助手——经济实证研究的诚信、方法与工具》双语网页版:每章中文部在前,English Edition 在后,内容与最新合订 PDF 一致。
第6章 · 数据来源全景
学习目标
完成本章后,你应当能够:
识别数据来源:说出中国官方四件套 + 国际三剑客 + 金融数据组的覆盖范围与获取方式
评估数据质量:用四维框架(口径一致性 / 频率匹配 / 覆盖完整性 / 获取成本)评估候选数据源
合规获取数据:遵守爬虫三原则,用学校正版渠道获取商业数据库
产出数据源矩阵:完成
data_source_matrix.xlsx,为你的研究选定数据源
§6.1 官方门户四件套
中国官方统计门户
表 6.1 中国官方统计门户。
L5|L5|L5|L5|L5
数据源 & 网址 & 核心数据 & 适用方向 & 获取方式
国家统计局 & stats.gov.cn / data.stats.gov.cn & 国民经济核算 / 价格指数 / 人口 / 居民收入 / 农产品产量 & 三方向通用(宏观与农业底座) & 网页下载 / API
中国人民银行 & pbc.gov.cn(调查统计司) & 金融统计数据报告 / 社会融资规模 / 货币政策执行报告 / 利率 / LPR & 【金】货币金融主源 & 报告 PDF 下载
国家金融监督管理总局 & nfra.gov.cn & 银行业总资产总负债(月度)/ 各地区保费收入 / 行业运行 & 【金】【险】监管口径主源 & 统计报表下载
农业农村部 & moa.gov.cn & 种植业 / 畜牧业 / 农业农村经济信息 & 【农】【险】农业底座 & 数据频道下载\
延伸门户(按需使用)
海关总署:进出口贸易数据
证监会:资本市场数据(上市公司公告、IPO)
中国债券信息网 chinabond.com.cn:债券估值、收益率曲线
跟做练习
从国家统计局下载“农村居民人均可支配收入”2010-2025 年年度时间序列:
打开 data.stats.gov.cn → 年度数据
选择“人民生活” → “居民人均可支配收入”
筛选“农村” + 时间范围 2010-2025
下载 Excel → 存入
data/raw/文件夹记录元数据(S6.1):来源 URL、下载日期、文件大小
§6.2 国际三剑客(本机 MCP 实装)
三大国际组织数据源
表 6.2 三大国际组织数据源。
L5|L5|L5|L5|L5
数据源 & MCP 工具 & 数据库 & 覆盖范围 & 适用场景
IMF & imf-mcp-server(5 个工具) & IFS 国际金融统计 / WEO 世界经济展望 & 全球 190+ 国家宏观金融指标 & 跨国金融稳定分析、资本充足率对比
OECD & oecd-mcp(9 个工具) & OECD 数据流 + 指标 & 38 个成员国 + 伙伴国 & 农业政策对比、乡村发展指标
FAO & (6 个工具) & FAOSTAT 69 个数据域 & 200+ 国家/地区 & 农业产量、粮食安全、土地利用、化肥\
延伸:World Bank
World Bank WDI(世界发展指标)和 GFDD(全球金融发展数据库)可通过网页直查:
WDI: data.worldbank.org(200+ 国家、1600+ 指标)
GFDD: 金融包容性指标(银行账户覆盖率、ATM 密度等)
跟做示例:用 imf-mcp 查询中国银行业资本充足率
工具:imf_query_dataset
参数:
  dataset_code: "IFS"(国际金融统计)
query: { country: "CN", indicator: "capital_adequacy_ratio", period: "2015-2025" }你需要做的:
用 imf-mcp-server 获取中国银行业资本充足率 2015-2025 时间序列
记录数据来源(S6.1):“IMF International Financial Statistics, accessed via imf-mcp-server, 2026-09-21”
存入
data/raw/imf_capital_adequacy_CHN.csv
[提示] MCP 工具的优势:直接在命令行/AI 助手中调用,无需打开网页手动下载。但数据出处的引用规范不能因为获取方式便利就省略。
§6.3 金融数据组(专业数据源)
按获取方式分三层
第一层:商业终端(学校订阅 / 机构付费)
表 6.3 按获取方式分三层。
L4|L4|L4|L4
数据源 & 覆盖范围 & 获取方式 & 适用场景
Wind & A 股 / 债券 / 基金 / 宏观 / 行业,最全 & 学校图书馆 VPN 或终端 & 论文标准数据源(审稿人认可度最高)
iFinD 同花顺 & 全品类金融数据(7 个子服务) & 学校/机构订阅 & 替代 Wind 的选择
Choice 东方财富 & 股票 / 基金 / 宏观 & 学校订阅 & 数据覆盖面广
Bloomberg & 全球市场 & 机构终端 & 国际金融方向\
第二层:学术数据库(学校订阅)
表 6.4 数据源 / 覆盖 / 特点速查表。
L3|L3|L3
数据源 & 覆盖 & 特点
CSMAR 国泰安 & 上市公司财务 / 公司治理 / 资本市场 & 面板数据最完整,论文引用率高
CNRDS 中国研究数据服务平台 & 绿色经济 / 创新 / 社会责任等特色数据 & 有独特的非财务指标
CFPS 中国家庭追踪调查 & 家庭收入/消费/资产/教育/健康 & 北京大学主持,微观面板
CHFS 中国家庭金融调查 & 家庭资产负债表/金融资产配置 & 西南财大主持,金融风险偏好\
第三层:开源免费(人人可用)
表 6.5 数据源 / 本机 MCP / 覆盖 / 注意事项速查表。
L4|L4|L4|L4
数据源 & 本机 MCP & 覆盖 & 注意事项
Tushare & tushareMcp(254 个工具) & A 股/基金/期货/宏观/港股/美股 & 需注册 token + 积分制
china-stock-mcp & china-stock-mcp(30 个工具) & A 股实时/历史/财务/资金流 & 免费替代
AKShare & Python 库 & A 股/港股/期货/宏观 & pip install akshare
yfinance & Python 库 & 全球股票市场 & Yahoo Finance 接口\
特色数据(专题方向必知)
表 6.6 数据 / 来源 / 适用速查表。
L3|L3|L3
数据 & 来源 & 适用
北京大学数字普惠金融指数 & 郭峰等(2020),蚂蚁金服合作 & 数字金融 / 普惠金融方向
中国家庭金融调查(CHFS) & 西南财经大学 & 家庭金融 / 风险偏好
中国农业统计年鉴 & 农业农村部 & 农业生产 / 保险精算\
[提示] 选择策略:硕士论文首选 Wind/CSMAR(审稿人熟悉);如果学校没订阅,Tushare + AKShare 可以覆盖 80% 的需求。关键是注明来源(S6.1)。
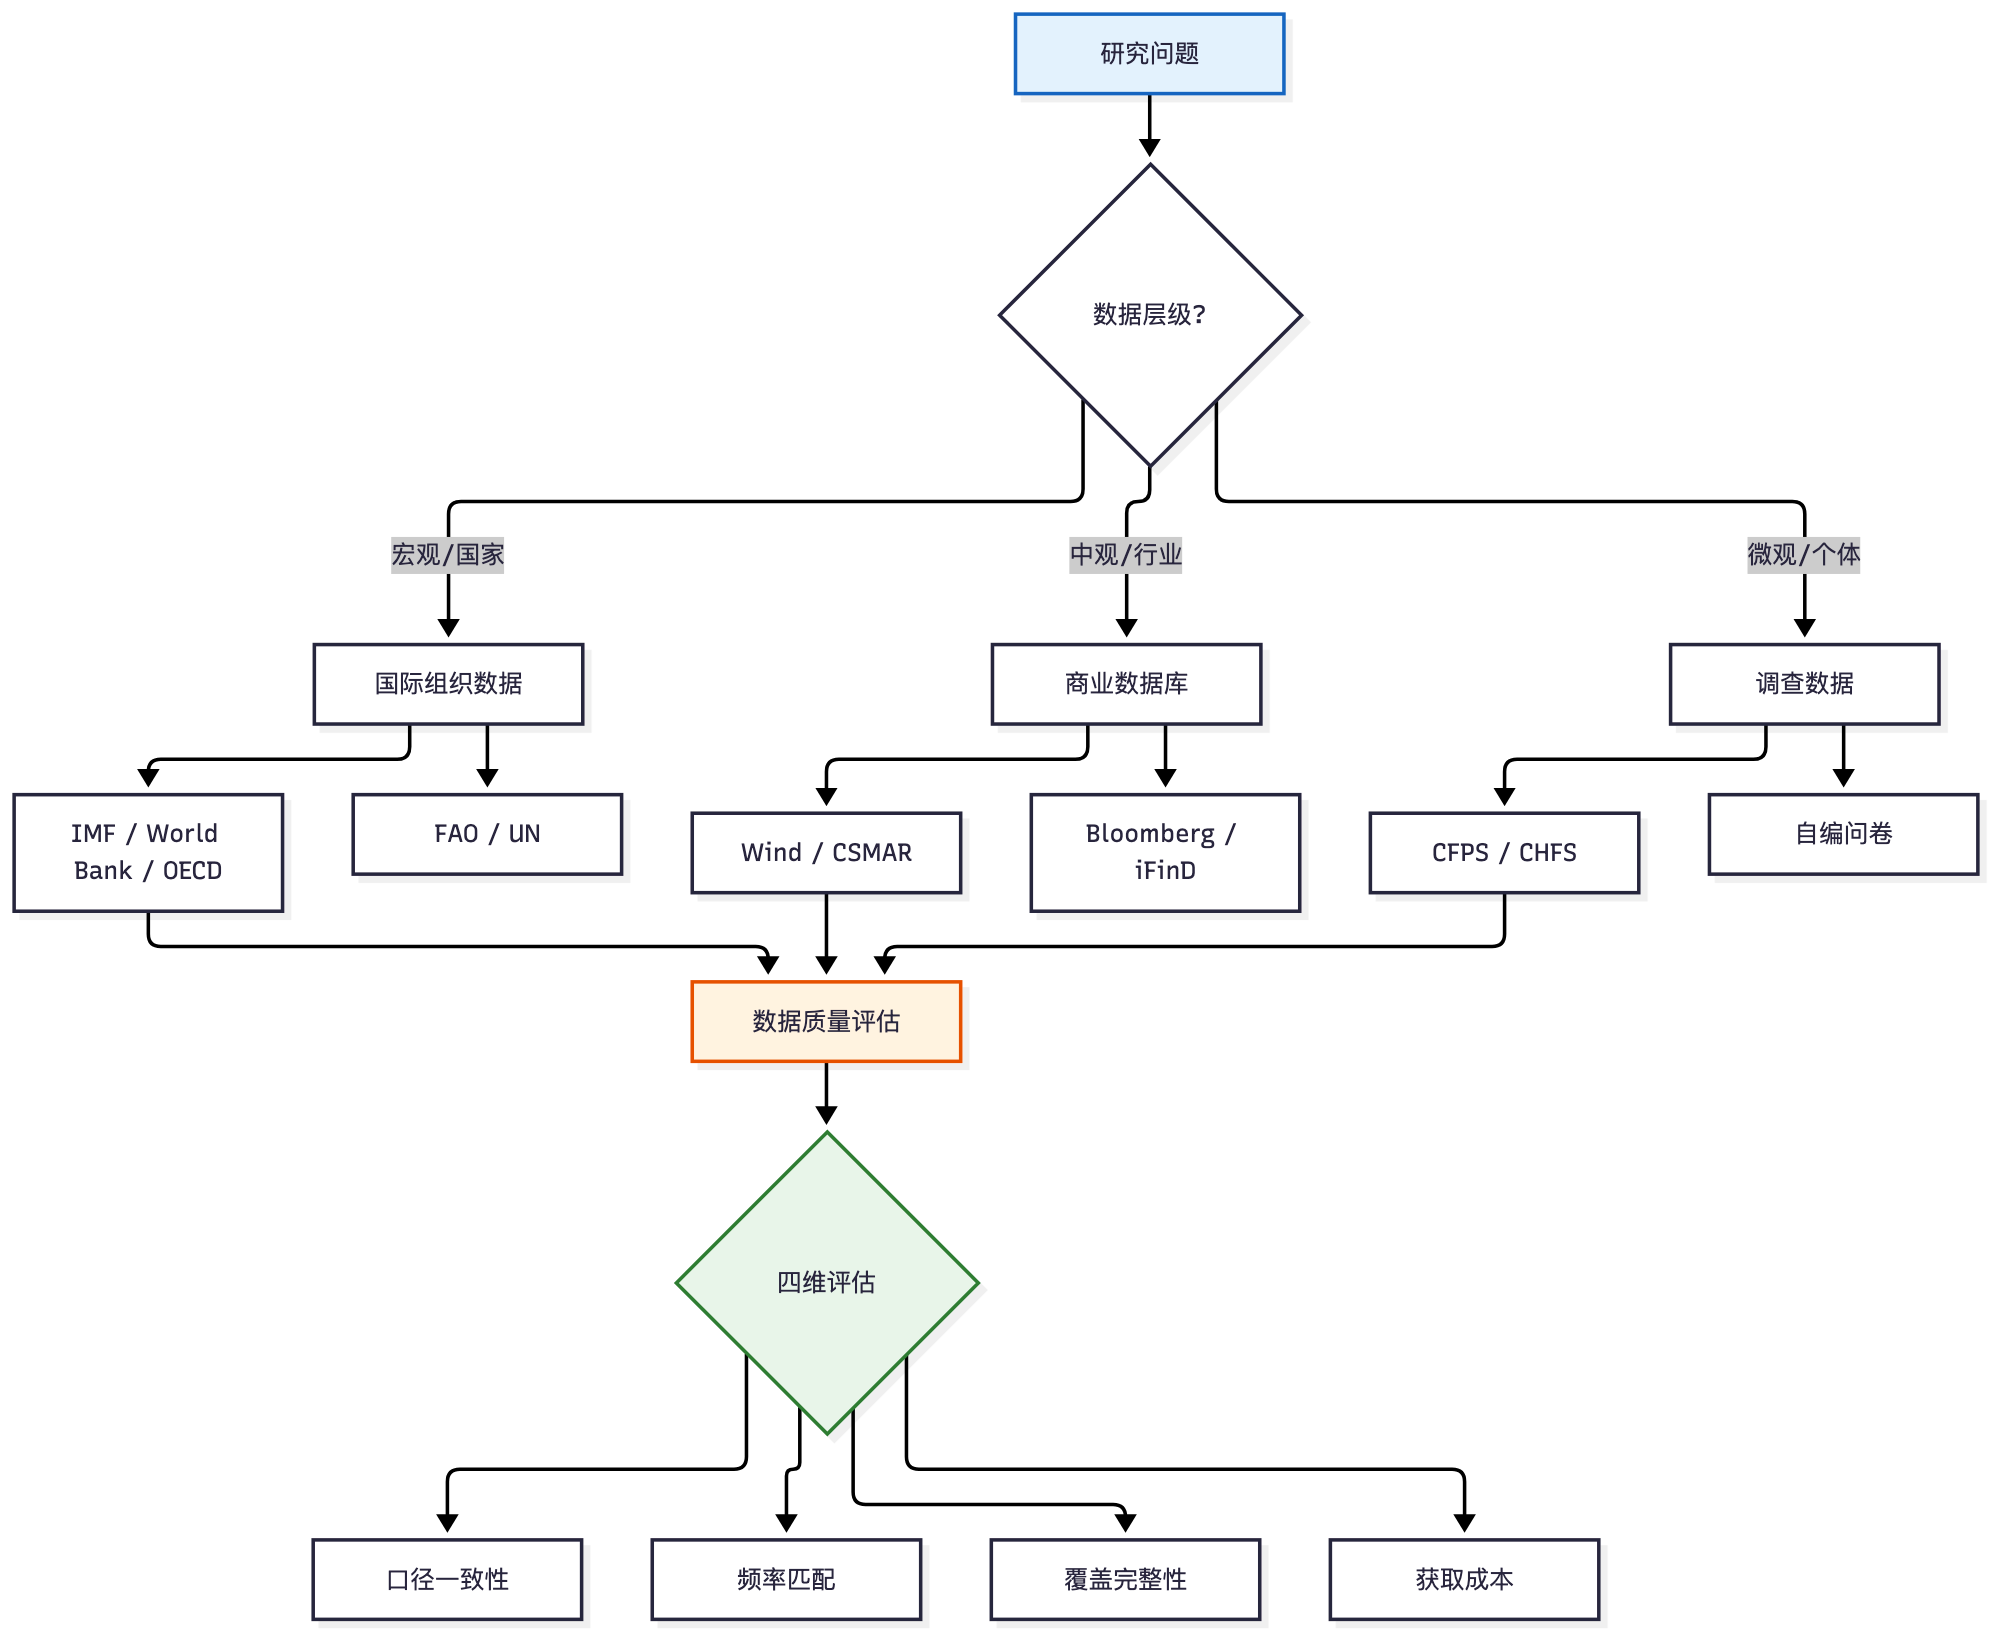
图 6.1 数据来源四象限全景——权威性 × 获取难度二维矩阵,帮你快速定位研究数据的入口。
§6.4 数据源选择决策树
四步选择法
面对一个研究问题,如何从众多数据源中选出最合适的一个?遵循以下四步:
明确变量定义:你的核心变量是什么?(如"农户收入"是年度可支配收入还是月度现金流?)
确定数据频率:需要年度/季度/月度/日度数据?面板还是截面?
评估覆盖范围:需要全国/省份/县域/村级/个体层面数据?
权衡获取成本:学校订阅了哪些数据库?开源数据能否满足?
决策树示例
你的研究问题是什么?
├─ 宏观金融稳定分析
│  ├─ 跨国比较 → IMF IFS / WEO
│  ─ 中国时间序列 → 人民银行 / 国家统计局
├─ 微观家庭金融
│  ├─ 全国代表性样本 → CFPS / CHFS
│  └─ 特定地区 → 自编问卷
├─ 上市公司研究
│  ├─ 财务数据 → CSMAR / Wind
│  └─ 创新/绿色 → CNRDS
└─ 农业/农村发展
   ├─ 宏观统计 → 国家统计局 / 农业农村部
   └─ 微观调查 → 自编问卷 / CHFS
案例:数字普惠金融对农户收入的影响
假设你的研究问题是"数字普惠金融发展对农户收入的影响",需要以下数据:
表 6.7 案例:数字普惠金融对农户收入的影响。
L3|L3|L3
变量 & 候选数据源 & 选择理由
数字普惠金融指数 & 北大数字金融研究中心 & 唯一省级/县级/村级数字金融指数
农户收入 & CFPS / 国家统计局 & CFPS 有家庭微观数据;统计局只有省级
控制变量(教育/年龄等) & CFPS & 微观调查包含人口统计学变量\
最终选择:CFPS 微观面板 + 北大数字金融指数(县级)匹配。
[提示] 数据源选择没有"标准答案",只有"最适合你的研究设计"。关键是在论文中说明选择理由,让审稿人看到你的决策过程。
§6.5 爬虫合规三原则 + 四维质量评估
网络数据采集合规三原则
表 6.8 网络数据采集合规三原则。
L4|L4|L4|L4
# & 原则 & 含义 & 违反后果
1 & 遵守 robots.txt & 网站明确禁止爬取的路径不碰 & 法律风险(反不正当竞争法)
2 & 控制请求频率 & 不给服务器造成负担(建议 ≥ 1 秒/次) & IP 被封禁;影响他人正常使用
3 & 尊重版权与隐私 & 不爬付费内容;不爬个人隐私数据 & 学术不端 + 法律风险\
工具提示:本机 chrome-devtools MCP 可以抓取公开统计表格(如金融监管总局的地区保费表),但必须遵守上述三原则。
四维数据质量评估框架
表 6.9 四维数据质量评估框架。
L4|L4|L4|L4
维度 & 含义 & 检查方法 & 对接第 5 章
口径一致性 & 同一指标不同年份的定义是否变化 & 查统计年鉴注释/官方口径说明 & → 内容效度(测的是不是同一个东西?)
频率匹配 & 数据频率是否满足研究需要 & 年度 vs 季度 vs 月度 vs 日度 & → 测量精度(粗粒度 = 信息损失)
覆盖完整性 & 是否有缺失地区/年份/行业 & 面板平衡性检验 & → 样本流失(第 4 章内部效度威胁之一)
获取成本 & 时间/金钱/技术门槛 & 评估 ROI(投入产出比) & → 可行性(设计阶段的现实约束)\
口径一致性的典型案例
案例:国家统计局“农村居民人均可支配收入”
2013 年之前:使用“纯收入”口径(扣除生产经营费用但不扣除社保缴费)
2013 年及之后:统一为“可支配收入”口径(扣除个税 + 社保缴费 + 转移支出)
影响:2013 年前后不可直接比较!如果你的研究跨越 2013 年,必须做口径调整或在论文中说明
△ 这是农经/农村金融方向最常踩的坑之一。很多论文直接把 2005-2025 年的收入数据拉成面板跑回归,完全没有注意到口径变化——审稿人一眼就看出来。
AI 辅助研究栏
1. 用 MCP 工具快速获取数据概览
场景:你想知道某个金融指标是否可获取、覆盖范围如何。
# 示例:用 tushareMcp 查看可用数据
工具:stock_basic
参数:{ exchange: "SSE", list_status: "L" }
-> 返回所有上交所上市公司列表

# 示例:用 faostat-mcp 查看农业数据域
工具:faostat_list_domains
-> 返回 69 个可查询域(产量/贸易/价格/化肥/土地…)
2. 自动化数据清洗建议
拿到原始数据后,贴给 AI 问:
“这份数据有哪些常见问题?(缺失值、异常值、格式不一致)”
“用什么 Stata 命令做初步清洗?”
“这个面板数据是否平衡?用
xtset+xtdescribe检查”
3. 数据源推荐
把你的研究问题告诉 AI:
我的研究问题是"数字普惠金融对农户收入的影响"。
请推荐 3-5 个可能的数据源,并说明各自的优缺点。
△ AI 推荐的数据源你必须自己验证是否存在、是否能获取、是否覆盖你的变量。AI 可能“幻觉”出不存在的数据库。
🛡 AI 诚信栏|S6.1 数据出处与版本留痕
必须做到:
✅ 每个数据集记录:来源 URL / 下载日期 / 版本号 / 文件大小
✅
data/raw/文件夹存放原始下载文件,永不修改✅ 论文中注明:“数据来源于 XX(访问日期 YYYY-MM-DD)”
✅ MCP 工具获取的数据同样注明:“IMF IFS, accessed via imf-mcp-server, 2026-09-21”
数据留痕模板:
# 数据获取日志

| 日期 | 数据源 | URL/工具 | 文件名 | 大小 | 备注 |
|---|---|---|---|---|---|
| 2026-09-21 | 国家统计局 | data.stats.gov.cn | rural_income_2010_2025.xlsx | 45KB | 年度数据 |
| 2026-09-22 | IMF IFS | imf-mcp-server | imf_car_CHN.csv | 12KB | 资本充足率 |
S6.2 爬虫合规
绝对禁止:
❌ 爬取需要登录的付费数据库(Wind/CSMAR/Bloomberg)→ 用学校正版渠道
❌ 爬取个人隐私数据(身份证号/手机号/银行账号)
❌ 绕过验证码、反爬机制
❌ 批量转售或二次发布原始数据
正确做法:
✅ 只抓公开页面的统计表格
✅ 请求频率 ≥ 1 秒/次
✅ 引用规范与手动下载完全一致
本章产出物
data_source_matrix.xlsx(数据源对比矩阵)
用 Excel 建立你的数据源评估矩阵:
表 6.10 data_source_matrix.xlsx(数据源对比矩阵)。
L4|L4|L4|L4
研究变量 & 候选数据源 1 & 候选数据源 2 & 候选数据源 3
(如:农户收入) & CFPS & 国家统计局 & 自编问卷
口径一致性(1-5) & 4 & 3(2013 口径变化) & 5(自己设计)
频率匹配(1-5) & 5(两年一次面板) & 4(年度) & 5(按需)
覆盖完整性(1-5) & 4(25 省) & 5(全国) & 3(仅样本县)
获取成本(1-5) & 3(需申请) & 5(免费下载) & 2(需入户)
综合得分 & 16 & 17 & 15
最终选择 & & ✅ &\
[提示] 评分规则:5 = 最好,1 = 最差。最终选择不仅看分数,还要看你的研究设计需要(如需面板数据,截面数据得分再高也不行)。
English Edition
Chapter 6 · A Panorama of Data Sources
Data is the raw material of empirical research. This chapter organizes the data sources commonly used in financial research—especially rural finance research—into four blocks: the four official portals, the international big three, financial data sources in three tiers, and the decision-tree selection method. All of these have been tested on this very machine (the MCP tools actually run). After finishing this chapter you will have a data_source_matrix.xlsx that provides a documented, defensible answer to the question “Where does your data come from?”
Learning Objectives
After completing this chapter, you should be able to:
Identify data sources: state the coverage and access routes of China’s official big four, the international big three, and the financial data group
Assess data quality: evaluate candidate data sources with the four-dimension framework (definitional consistency / frequency match / coverage completeness / acquisition cost)
Acquire data compliantly: follow the three web-scraping principles and use the university’s licensed channels for commercial databases
Produce a data-source matrix: complete
data_source_matrix.xlsxand settle on the data sources for your research
6.1 The Four Official Portals
China’s Official Statistical Portals
Table 6.1 China’s official statistical portals.
L5|L5|L5|L5|L5
Source & URL & Core data & Research fit & Access
National Bureau of Statistics & stats.gov.cn / data.stats.gov.cn & National accounts / price indices / population / household income / farm output & Universal for all three tracks (macro and agriculture base) & Web download / API
People’s Bank of China & pbc.gov.cn (Survey and Statistics Dept.) & Financial statistics reports / aggregate social financing / monetary policy reports / interest rates / LPR & 【Fin】primary source for monetary finance & Report PDF downloads
National Financial Regulatory Administration & nfra.gov.cn & Banking assets and liabilities (monthly) / regional premium income / industry performance & 【Fin】【Ins】primary source of regulatory data & Statistical reports
Ministry of Agriculture and Rural Affairs & moa.gov.cn & Crop farming / animal husbandry / agricultural-rural economy & 【Agr】【Ins】agriculture base & Data channel downloads\
Extended Portals (Use as Needed)
General Administration of Customs: import–export trade data
China Securities Regulatory Commission: capital market data (listed-company announcements, IPOs)
ChinaBond chinabond.com.cn: bond valuations, yield curves
Hands-On Exercise
Download the 2010–2025 annual series of “per capita disposable income of rural residents” from the NBS:
Open data.stats.gov.cn → Annual data
Choose “People’s livelihood” → “Per capita disposable income”
Filter “rural” + time span 2010–2025
Download the Excel → save it in the
data/raw/folderRecord the metadata (S6.1): source URL, download date, file size
6.2 The International Big Three (Implemented as Local MCP Tools)
Data Sources of the Three International Organizations
Table 6.2 Data sources of the three international organizations.
L5|L5|L5|L5|L5
Source & MCP tool & Database & Coverage & Use cases
IMF & imf-mcp-server (5 tools) & IFS International Financial Statistics / WEO World Economic Outlook & Macro-finance indicators for 190+ countries & Cross-country financial stability, capital adequacy comparisons
OECD & oecd-mcp (9 tools) & OECD dataflows + indicators & 38 member countries + partners & Agricultural policy comparison, rural development indicators
FAO & (6 tools) & FAOSTAT, 69 data domains & 200+ countries/regions & Farm output, food security, land use, fertilizers\
Extension: World Bank
World Bank WDI (World Development Indicators) and GFDD (Global Financial Development Database) can be queried directly on the web:
WDI: data.worldbank.org (200+ countries, 1,600+ indicators)
GFDD: financial inclusion indicators (bank account coverage, ATM density, etc.)
Hands-On Example: Querying Chinese Banks’ Capital Adequacy via imf-mcp
Tool: imf_query_dataset
Arguments:
  dataset_code: "IFS" (International Financial Statistics)
  query: { country: "CN", indicator: "capital_adequacy_ratio", period: "2015-2025" }
What you need to do:
Use imf-mcp-server to fetch the 2015–2025 capital adequacy series of Chinese banks
Record the source (S6.1): “IMF International Financial Statistics, accessed via imf-mcp-server, 2026-09-21”
Save as
data/raw/imf_capital_adequacy_CHN.csv
[Tip] The advantage of MCP tools: call them straight from the command line / AI assistant without opening a browser to download manually. But the citation norms for data provenance must never be skipped just because access has become easy.
6.3 The Financial Data Group (Professional Sources)
Three Tiers by Access Route
Tier 1: Commercial Terminals (University / Institutional Subscription)
Table 6.3 The three tiers by access route.
L4|L4|L4|L4
Source & Coverage & Access & Use cases
Wind & A-shares / bonds / funds / macro / industries, the most complete & University library VPN or terminal & The standard source for theses (highest reviewer recognition)
iFinD (Hexin Flush) & All financial data categories (7 sub-services) & University / institutional subscription & The alternative to Wind
Choice (Eastmoney) & Stocks / funds / macro & University subscription & Broad data coverage
Bloomberg & Global markets & Institutional terminal & International finance track\
Tier 2: Academic Databases (University Subscription)
Table 6.4 Sources, coverage, and features.
L3|L3|L3
Source & Coverage & Features
CSMAR (GTARS) & Listed firms’ financials / governance / capital markets & The most complete panel data; heavily cited in papers
CNRDS & Green economy / innovation / CSR and other distinctive data & Unique non-financial indicators
CFPS (China Family Panel Studies) & Household income / consumption / assets / education / health & Run by Peking University; micro panel
CHFS (China Household Finance Survey) & Household balance sheets / financial asset allocation & Run by Southwestern University of Finance and Economics; risk preferences\
Tier 3: Open Source (Available to Everyone)
Table 6.5 Sources, local MCP tools, coverage, and caveats.
L4|L4|L4|L4
Source & Local MCP & Coverage & Caveats
Tushare & tushareMcp (254 tools) & A-shares / funds / futures / macro / HK stocks / US stocks & Requires a registered token + points system
china-stock-mcp & china-stock-mcp (30 tools) & A-share real-time / historical / financials / fund flows & Free alternative
AKShare & Python library & A-shares / HK stocks / futures / macro & pip install akshare
yfinance & Python library & Global equity markets & Yahoo Finance interface\
Distinctive Data (Must-Know for Specialized Tracks)
Table 6.6 Data, source, and research fit.
L3|L3|L3
Data & Source & Research fit
Peking University Digital Financial Inclusion Index & Guo Feng et al. (2020), with Ant Financial & Digital finance / inclusive finance
China Household Finance Survey (CHFS) & Southwestern University of Finance and Economics & Household finance / risk preferences
China Agricultural Statistical Yearbook & Ministry of Agriculture and Rural Affairs & Agricultural production / insurance actuarial work\
[Tip] Selection strategy: for a master’s thesis prefer Wind/CSMAR (familiar to reviewers); if your university lacks a subscription, Tushare + AKShare can cover 80% of needs. The key is to cite the source (S6.1).
Figure 6.1 A four-quadrant panorama of data sources—an authority × access-difficulty matrix that helps you locate the entry point for your research data.
6.4 The Data-Source Decision Tree
The Four-Step Selection Method
Given a research question, how do you pick the most suitable source from many candidates? Follow these four steps:
Define your variables: What exactly are your core variables? (For example, is “farm household income” annual disposable income or monthly cash flow?)
Fix the data frequency: Do you need annual / quarterly / monthly / daily data? Panel or cross-section?
Assess coverage: Do you need national / provincial / county / village / individual level data?
Weigh acquisition cost: Which databases does your university subscribe to? Can open sources suffice?
A Decision-Tree Example
What is your research question?
|-- Macro financial stability
|   |-- Cross-country comparison -> IMF IFS / WEO
|   '-- China time series      -> PBoC / NBS
|-- Micro household finance
|   |-- Nationally representative -> CFPS / CHFS
|   '-- Specific region           -> Own survey
|-- Listed-company research
|   |-- Financial data        -> CSMAR / Wind
|   '-- Innovation/green      -> CNRDS
'-- Agriculture / rural development
    |-- Macro statistics      -> NBS / MOA
    '-- Micro survey          -> Own survey / CHFS
Case Study: Digital Financial Inclusion and Farm Household Income
Suppose your research question is “the impact of digital financial inclusion on farm household income.” You need the following data:
Table 6.7 Case study: digital financial inclusion and farm household income.
L3|L3|L3
Variable & Candidate sources & Rationale
Digital financial inclusion index & Peking University Digital Finance Research Center & The only province/county/village-level digital finance index
Farm household income & CFPS / NBS & CFPS has household micro data; the NBS offers province level only
Controls (education / age, etc.) & CFPS & Micro surveys include demographic variables\
Final choice: CFPS micro panel matched with the PKU digital finance index (county level).
[Tip] There is no “standard answer” in data-source selection—only “the best fit for your research design.” The key is to state your selection rationale in the paper so reviewers can see your decision process.
6.5 Three Web-Scraping Compliance Principles + Four-Dimension Quality Assessment
Three Compliance Principles for Web Data Collection
Table 6.8 Three compliance principles for web data collection.
L4|L4|L4|L4
# & Principle & Meaning & Consequences of violation
1 & Obey robots.txt & Never touch paths the website explicitly forbids & Legal risk (Anti-Unfair Competition Law)
2 & Control request frequency & Do not burden the server (recommend ≥ 1 request/second) & IP bans; harming other users
3 & Respect copyright and privacy & No scraping paywalled content; no scraping personal data & Academic misconduct + legal risk\
Tool note: the local chrome-devtools MCP can scrape public statistical tables (e.g., the NFRA regional premium table), but you must observe the three principles above.
The Four-Dimension Data Quality Framework
Table 6.9 The four-dimension data quality framework.
L4|L4|L4|L4
Dimension & Meaning & How to check & Link to Chapter 5
Definitional consistency & Has the definition of the same indicator changed across years? & Check yearbook notes / official definitions & → Content validity (is it measuring the same thing?)
Frequency match & Does the data frequency meet the research need? & Annual vs quarterly vs monthly vs daily & → Measurement precision (coarse granularity = information loss)
Coverage completeness & Any missing regions / years / industries? & Panel balance tests & → Sample attrition (one of Chapter 4’s internal validity threats)
Acquisition cost & Time / money / technical threshold & Evaluate the ROI & → Feasibility (a real constraint at the design stage)\
A Classic Case of Definitional Inconsistency
Case: the NBS’s “per capita disposable income of rural residents”
Before 2013: the “net income” definition (deducting production costs but not social insurance contributions)
From 2013 on: unified to the “disposable income” definition (deducting income tax + social insurance + transfer expenditures)
Impact: the pre- and post-2013 figures are not directly comparable! If your study spans 2013, you must adjust the definition or state so in the paper
△ This is one of the most common traps in agricultural economics / rural finance. Many papers stack 2005–2025 income data into a panel and run regressions without noticing the definitional change—reviewers spot it at a glance.
AI-Assisted Research Corner
1. Getting a Quick Data Overview with MCP Tools
Scenario: you want to know whether a financial indicator is available and how well it is covered.
# Example: list available data with tushareMcp
Tool: stock_basic
Arguments: { exchange: "SSE", list_status: "L" }
-> Returns the list of all SSE-listed companies

# Example: explore agricultural data domains with faostat-mcp
Tool: faostat_list_domains
-> Returns 69 queryable domains (output / trade / prices / fertilizer / land ...)
2. Suggestions for Automated Data Cleaning
After obtaining raw data, paste it to the AI and ask:
“What common problems does this dataset have? (missing values, outliers, inconsistent formats)”
“Which Stata commands should I use for preliminary cleaning?”
“Is this panel balanced? Check with
xtset+xtdescribe”
3. Data-Source Recommendations
Tell the AI your research question:
My research question is "the impact of digital financial
inclusion on farm household income."
Please recommend 3-5 possible data sources with their
respective pros and cons.
△ You must personally verify every data source the AI recommends: does it exist, can you access it, does it cover your variables? AI can “hallucinate” databases that do not exist.
🛡 AI Integrity|S6.1 Data Provenance and Version Records
You must:
✅ For every dataset record: source URL / download date / version / file size
✅ Keep original downloads in the
data/raw/folder and never modify them✅ State in the paper: “Data from XX (accessed YYYY-MM-DD)”
✅ For MCP-acquired data likewise note: “IMF IFS, accessed via imf-mcp-server, 2026-09-21”
Data provenance log template:
# Data acquisition log

| Date       | Source | URL/Tool          | File                        | Size | Note        |
|------------|--------|-------------------|-----------------------------|------|-------------|
| 2026-09-21 | NBS    | data.stats.gov.cn | rural_income_2010_2025.xlsx | 45KB | Annual data |
| 2026-09-22 | IMFIFS | imf-mcp-server    | imf_car_CHN.csv             | 12KB | Cap. adequacy |
S6.2 Web-Scraping Compliance
Absolutely forbidden:
❌ Scraping subscription databases behind logins (Wind/CSMAR/Bloomberg) → use the university’s licensed channels
❌ Scraping personal private data (ID numbers / phone numbers / bank accounts)
❌ Bypassing CAPTCHAs or anti-scraping mechanisms
❌ Reselling or republishing raw data in bulk
The right way:
✅ Scrape only statistical tables on public pages
✅ Request frequency ≥ 1 second per request
✅ Cite exactly as you would for a manual download
Chapter Deliverables
data_source_matrix.xlsx (Data-Source Comparison Matrix)
Build your data-source evaluation matrix in Excel:
Table 6.10 data_source_matrix.xlsx (data-source comparison matrix).
L4|L4|L4|L4
Research variable & Candidate source 1 & Candidate source 2 & Candidate source 3
(e.g., farm household income) & CFPS & NBS & Own survey
Definitional consistency (1–5) & 4 & 3 (2013 definitional change) & 5 (self-designed)
Frequency match (1–5) & 5 (biennial panel) & 4 (annual) & 5 (on demand)
Coverage completeness (1–5) & 4 (25 provinces) & 5 (national) & 3 (sample counties only)
Acquisition cost (1–5) & 3 (application needed) & 5 (free download) & 2 (field visits)
Composite score & 16 & 17 & 15
Final choice & & ✅ &\
[Tip] Scoring rule: 5 = best, 1 = worst. The final choice is not just about scores—it must also fit your research design (e.g., if you need panel data, no cross-section data qualifies no matter how highly it scores).