📖 《把 AI 当助手——经济实证研究的诚信、方法与工具》双语网页版:每章中文部在前,English Edition 在后,内容与最新合订 PDF 一致。
第2章 · 像研究者一样思考:科学、构念与理论
学习目标
完成本章后,你应当能够:
用归纳-演绎循环解释一项具体研究(如 Diamond-Dybvig 1983[8] 银行挤兑模型)处于哪个半环
区分概念/构念/变量三层并各举 1 个金融例子
把一个生活现象(如“村里用移动支付的人更多了”)提炼成研究问题(What/Why/How 句式)
画出“构念→变量→假设”的理论草图(AI 辅助 mermaid + 人工把关)
说出三大研究范式(实证/诠释/批判)与自己选题的适配关系
[提示] 本章不写代码、不跑回归——它训练的是你脑子里“想清楚问题”的能力。很多同学论文写到一半推翻重来,根因往往就在这一章没做好。
§2.1 科学方法两支柱:归纳与演绎循环
什么是归纳(Induction)?
定义:从具体观察中发现规律,再提炼为理论。方向是“自下而上”。
金融例子:
观察:你跑了四川 10 家村镇银行的不良贷款率,发现它们都显著高于同城的大型商业银行
归纳:“小银行风控能力弱于大银行”
形成理论:规模-风险假说(银行规模越小→风控系统投入不足→不良率越高)
归纳研究也叫“理论构建研究”——研究者根据观察到的数据来构建理论概念及其模式。
什么是演绎(Deduction)?
定义:从已有理论出发,推导出可检验的假设,再用数据验证。方向是“自上而下”。
金融例子:
理论:代理理论(Jensen & Meckling 1976[9])预测“股权越分散→管理层偷懒空间越大”
推导假设:股权集中度与前 1 大股东持股比例正相关,与 ROA 正相关
收集数据:从 CSMAR 下载 A 股上市公司数据,跑面板回归验证
演绎研究也叫“理论检验研究”——通过经验数据对既有理论中的概念和模型进行检验。
归纳-演绎循环图
        +-------- 归纳 --------+
        |                      |
   理论/命题 <----------  观察/数据
        |                      ▲
        |                      |
        +-------- 演绎 --------+
              (假设->检验)
经典案例:Diamond-Dybvig 1983 银行挤兑模型
这是金融学最著名的理论论文之一(2022 年诺贝尔经济学奖),完美展示了归纳-演绎循环:
表 2.1 经典案例:Diamond-Dybvig 1983 银行挤兑模型。
L2|L2
阶段 & 内容
归纳半环 & Diamond 和 Dybvig 观察到历史上反复出现银行挤兑现象(1930 年代美国大萧条、各国金融危机),从中归纳出一个核心洞察:银行挤兑可能是“自我实现的预言”——存款人因为害怕别人先取钱而抢先取钱
演绎半环 & 基于“存款合约+协调失败”的理论框架,演绎出两个关键预测:①存款保险可以防止挤兑(因为消除了“抢先取”的动机);②暂停兑付也可以防止挤兑
后续验证 & 大量实证研究用 FDIC 数据、各国存款保险制度变迁验证了模型预测(如 Demirgüç-Kunt & Detragiache 2002)\
原始论文与延伸阅读(GB/T 7714—2025 著录)
【开创性原始论文】
- DIAMOND D W, DYBVIG P H. Bank runs, deposit insurance, and liquidity[J]. Journal of Political Economy, 1983, 91(3): 401–419. DOI: 10.1086/261155. 在线全文(开放):https://www.journals.uchicago.edu/doi/10.1086/261155;预印本 PDF:https://www.bu.edu/econ/files/2012/01/DD83jpe.pdf
【后续代表性观点(按时间排序)】
GORTON G. Banking panics and business cycles[J]. Oxford Economic Papers, 1988, 40(4): 751–781. 在线:https://academic.oup.com/oep/article-abstract/40/4/751/2362190;JSTOR 备份:https://www.jstor.org/stable/2662350.
*观点:*以美国 19 世纪末到 20 世纪初的银行恐慌史为样本,提出“恐慌源于信息不对称下存款人对银行资产质量的集体误判”,为 Diamond-Dybvig 模型提供历史证据。CALOMIRIS C W, GORTON G. The origins of banking panics: models, facts, and bank regulation[M]//HUBBARD R G. Financial Markets and Financial Crises. Chicago: University of Chicago Press, 1991: 109–173. NBER 章节 PDF(开放):https://www.nber.org/system/files/chapters/c11484/c11484.pdf.
*观点:*把 Diamond-Dybvig 的纯理论模型与 NBER 金融史数据库对接,用 1873—1933 年美国银行倒闭数据测算“挤兑触发阈值”,发现存款保险制度(FDIC)确实将挤兑概率降至零。DIAMOND D W. Liquidity, banks, and markets[J]. Journal of Political Economy, 1997, 105(5): 928–956. DOI: 10.1086/262099. 在线:https://www.journals.uchicago.edu/doi/abs/10.1086/262099.
*观点:*Diamond 自我扩展原模型,证明当 市场与银行并存时,跨期交易摩擦会产生“短期债券 + 银行”的最优契约分工——市场承担套期保值、银行承担跨期平滑。ALLEN F, GALE D. Financial contagion[J]. Journal of Political Economy, 2000, 108(1): 1–33. DOI: 10.1086/262109. 在线:https://www.journals.uchicago.edu/doi/10.1086/262109.
*观点:*把单一银行挤兑扩展为银行间互联下的系统性危机——地区间银行通过共同资产配置形成“收益相关性”,一个地区冲击会通过资产价格渠道传染至其他地区(2008 金融危机的重要理论基础)。GOLDSTEIN I, PAUZNER A. Demand-deposit contracts and the probability of bank runs[J]. Journal of Finance, 2005, 60(3): 1293–1327. DOI: 10.1111/j.1540-6261.2005.00762.x. 在线:https://onlinelibrary.wiley.com/doi/abs/10.1111/j.1540-6261.2005.00762.x;Wharton 预印本:https://finance.wharton.upenn.edu/~itayg/Files/bankruns-published.pdf.
*观点:*在 Diamond-Dybvig 框架上加入全局博弈(global games)技术,导出挤兑发生的精确概率公式——存款人的“取款决策”依赖于对其他存款人行为的临界信念,存款保险有效性取决于临界信念的设计。CHEN Q, GOLDSTEIN I, JIANG W. Payoff complementarities and financial fragility: evidence from mutual fund outflows[J]. Journal of Financial Economics, 2010, 97(2): 239–262. DOI: 10.1016/j.jfineco.2010.04.002. 在线:https://www.sciencedirect.com/science/article/abs/pii/S0304405X10000759.
*观点:*用 1993—2005 年美国共同基金面板数据检验“收益互补性 → 金融脆弱性”——当一只基金的收益与同业高度相关时,面临赎回冲击时被迫折价抛售的概率显著上升,把 Diamond-Dybvig 模型从银行扩展到所有“类存款”资产管理。
➤金融学硕或专硕同学原文精读提示:精读时按“Diamond-Dybvig 1983 → Gorton 1988 / Calomiris-Gorton 1991(历史验证)→ Diamond 1997(理论扩展)→ Allen-Gale 2000 / Goldstein-Pauzner 2005(模型深化)→ Chen-Goldstein-Jiang 2010(实证迁移)”的顺序读,构成从“纯理论”到“金融脆弱性全景”的完整证据链。
对你的启示
大多数金融实证论文走演绎路线:理论→假设→数据→回归→结论。这是第 9 章的主线
顶级理论创新往往来自归纳:观察到新现象→归纳出新理论。这是第 10 章案例研究的路线
两者的螺旋关系:在理论和现象解释均较少的新兴领域(如 2013 年刚出现的数字金融),归纳研究更有价值;在存在多个相互竞争理论的成熟领域(如资本结构理论),演绎研究更有效
§2.2 分析单元(Unit of Analysis)
为什么分析单元如此重要?
分析单元决定了三件事:
数据从哪里收集(第 5 章展开)
变量在哪个层级测量(第 5 章展开)
用什么方法分析(第 9 章展开)
选错分析单元 = 地基打歪了,后面全部白费。
四级分析单元
表 2.2 四级分析单元。
L4|L4|L4|L4
层级 & 含义 & 经济研究举例 & 典型数据来源
个体 & 单个人/家庭 & 农户借贷决策、投资者风险偏好、消费者金融素养 & 问卷调查、入户访谈
群体 & 一组有共同特征的人 & 某村全体农户、某类投资者群体、某省农村妇女 & 群体统计、焦点小组
组织 & 企业/机构 & 商业银行效率、保险公司偿付能力、合作社治理 & 年报、监管数据、CSMAR
社会/系统 & 行业/地区/国家 & 省际金融发展差异、银行业集中度、国家金融深化 & 统计年鉴、世界银行 WDI\
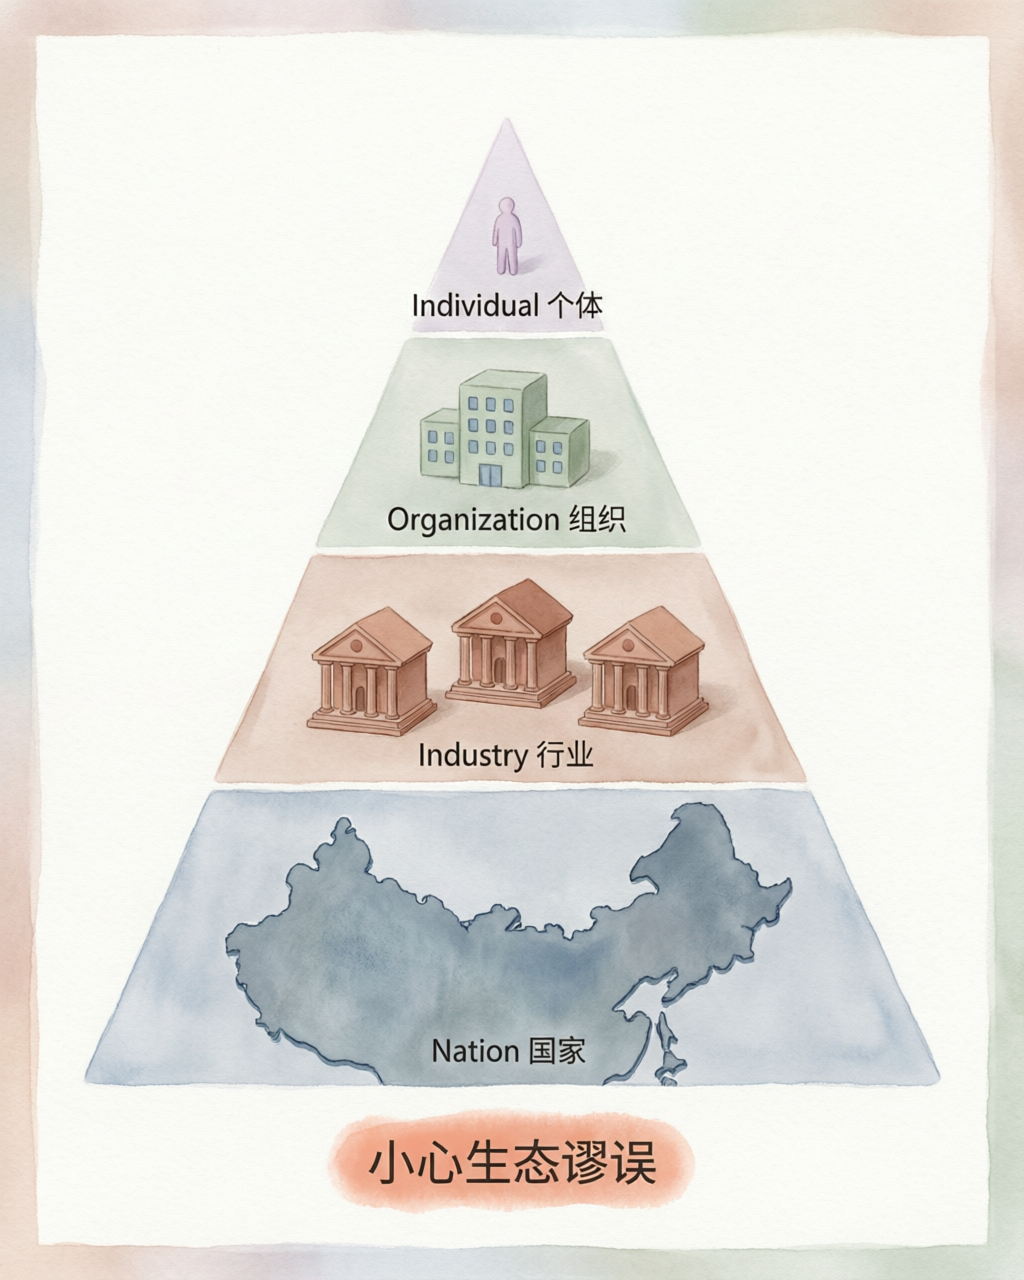
图 2.1 四级分析单元金字塔——个体 → 组织 → 行业 → 国家,注意底部的生态谬误警示。
! 生态谬误(Ecological Fallacy)——最常犯的错误
什么是生态谬误? 用高层级(群体)数据推断低层级(个体)行为。
经济研究中的典型错误:
表 2.3 生态谬误(Ecological Fallacy)——最常犯的错误。
L2|L2
做法 & 问题
用县级“北京大学数字普惠金融指数”推断“某个农户使用数字金融的概率” & ❌ 县级指数是该县所有人的平均,不能代表任何一个具体农户
用省级 GDP 增长率推断“该省每家银行都在扩张” & ❌ 省均增长可能掩盖个别银行萎缩
用某行业平均 ROA 推断“每家企业都盈利” & ❌ 均值掩盖分布\
正确做法:
如果你的研究问题是“农户个体是否使用数字金融”,分析单元 = 农户个体 → 必须收集农户层面数据(问卷调查)
如果研究问题是“数字金融发展水平较高的县,其农户收入是否更高”,分析单元 = 县 → 可用县级面板数据
反向错误(个体谬误/以偏概全):用单个案例推断整体规律。比如“我认识一个炒股赚钱的人,所以炒股都能赚钱”——这在学术上叫“选择性偏差”。
关键决策框
拿到你的研究问题后,问自己:
1. 我的研究问题是关于"谁"的?-> 确定分析单元
2. 我的数据是在哪个层级测量的?-> 检查是否匹配
3. 如果不匹配 -> 要么改问题,要么改数据层级行动项:在你的
research_question.md中,必须明确写出“分析单元 = ___”。这不是可选项——它是后续所有方法选择的锚点。
§2.3 概念、构念与变量
三层区分
表 2.4 三层区分。
L4|L4|L4|L4
层级 & 定义 & 特征 & 金融举例
概念(Concept) & 日常交流中的共识性标签 & 模糊、多义、无严格边界 & “金融素养”“风险”“信用”“缺钱”
构念(Construct) & 为研究目的有意创造(或选定)的抽象概念 & 有理论定义、不可直接观测、需操作化 & “金融素养水平”“风险厌恶程度”“信贷可得性”
变量(Variable) & 构念的可测量操作化表达 & 有取值、可量化、可放入回归方程 & “Lusardi 三问得分(0-3)”“风险投资占比”“是否获得正规贷款(0/1)”\
关键洞察
换言之——构念是研究者的工具,不是天然存在的。你需要为研究目的“打造”它。
科学研究需要操作化定义(而非词典定义)。词典定义用同义词循环解释(“态度是一种感觉,感觉是一种态度”),对研究无用。操作化定义要回答:你打算怎么测?
操作化链条示例
链条 1:农民“缺钱”
概念:"农民缺钱"(日常语言,模糊)
  v 理论化
构念:"金融排斥"(学术定义:个体无法获得正规金融服务的状态)
  v 操作化
变量 1:是否有正规银行账户(0/1)
变量 2:最近一年正规借贷次数(计数)
变量 3:距最近银行网点距离(公里)
链条 2:这个人“懂金融”
概念:"这个人懂金融"(日常语言)
  v 理论化
构念:"金融素养"(Lusardi & Mitchell 2014 定义:个体做出有效金融决策的能力)
  v 操作化
变量:Lusardi 三问得分(0-3 分)
  - 利率计算题(复利理解)
  - 通胀影响题(货币购买力)
  - 风险分散题(不要鸡蛋放一个篮子)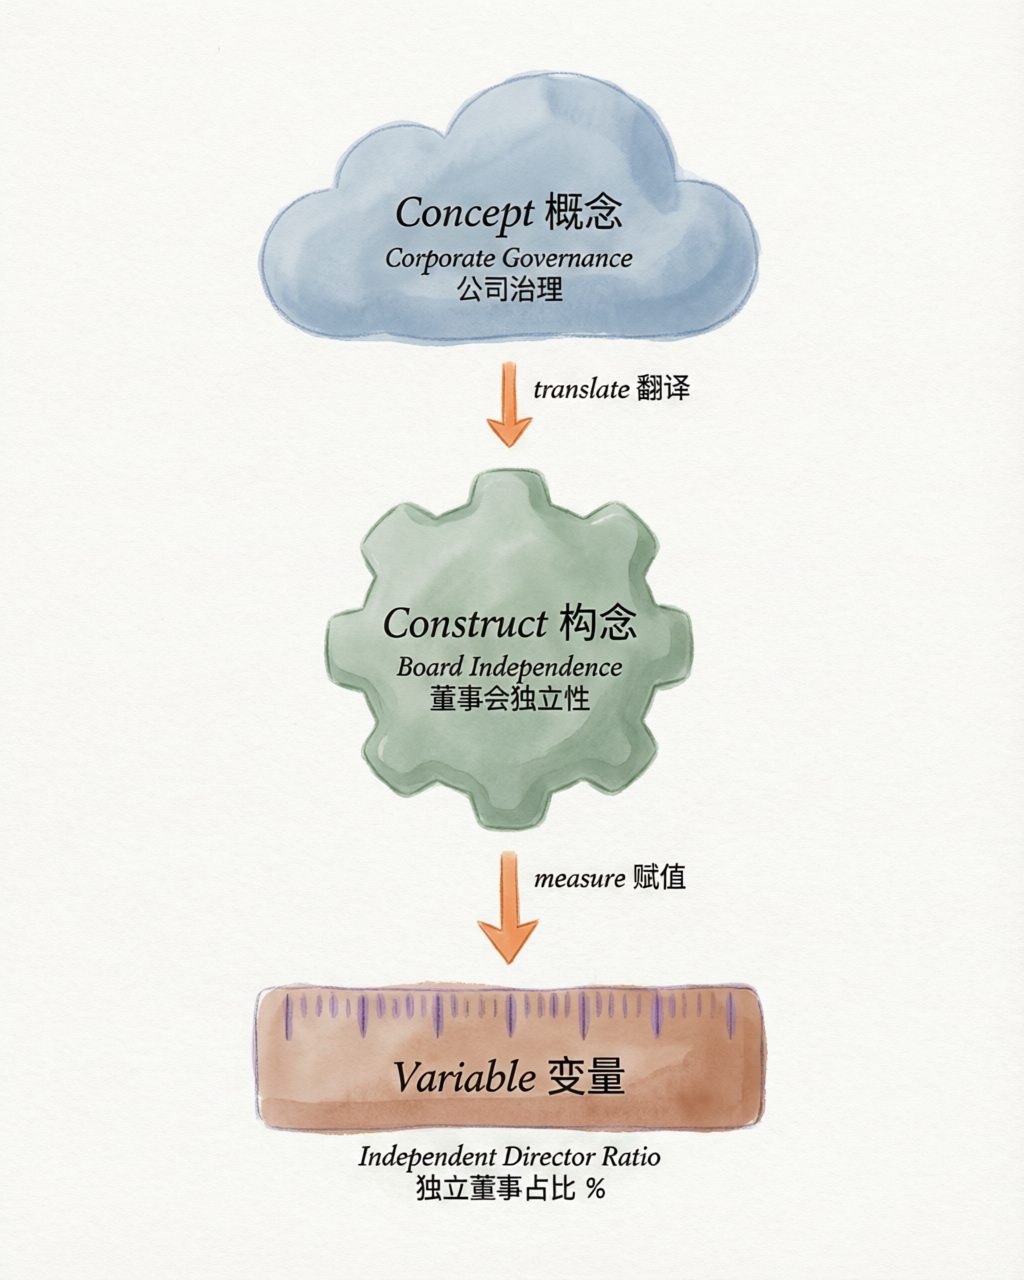
图 2.2 概念 → 构念 → 变量三层降维链——以「公司治理 → 董事会独立性 → 独董占比」为例。
命题与假设
表 2.5 命题与假设。
L3|L3|L3
& 命题(Proposition) & 假设(Hypothesis)
层面 & 理论层面 & 实证层面
对象 & 构念之间的关系 & 变量之间的关系
可否直接检验 & 不可——需通过假设间接检验 & 可——用数据直接检验
例子 & “金融素养越高,家庭储蓄率越高” & “Lusardi 三问得分每增加 1 分,家庭储蓄率上升 2.3 个百分点”\
从命题到假设的过程 = 操作化。第 5 章会详细展开。
! 最常见的论文“致命伤”
典型病例:
研究问题写的是“数字金融素养”,问卷测的却是“手机使用频率”——这不是同一回事
研究问题写的是“农户风险厌恶”,用的代理变量是“是否购买保险”——买不买保险还受收入、信息、渠道等影响,不能等同于风险厌恶
解药:在写研究问题时,就同步列出“我打算用什么变量测这个构念”,并去查文献看别人是怎么测的(第 3 章文献回顾的核心任务之一)。
变量类型速查(第 9 章会深入)
表 2.6 变量类型速查(第 9 章会深入)。
L3|L3|L3
变量类型 & 角色 & 金融例子
自变量(IV) & 原因/解释者 & 数字金融使用程度
因变量(DV) & 结果/被解释者 & 农户收入增长率
中介变量 & 传导机制 & 信贷可得性(数字金融→信贷可得→收入)
调节变量 & 影响 IV→DV 的强度 & 年龄(年轻人数字金融效果更强?)
控制变量 & 排除干扰 & 地区、教育年限、家庭规模\
§2.4 理论与模型
理论的四个构建模块
Whetten(1989)的经典框架:
表 2.7 理论的四个构建模块。
L3|L3|L3
模块 & 回答的问题 & 金融例子(代理理论)
构念 & 理论是“关于什么”的? & 委托人、代理人、信息不对称、道德风险
命题 & 构念之间“如何关联”? & 信息不对称
逻辑/机制 & “为什么”这样关联? & 因为委托人无法完全观测代理人行为,代理人有偷懒动机
边界条件 & “在什么情况下”成立? & 适用于委托-代理关系明确的组织(企业、银行),不适用于完全自我雇佣者\
优秀理论四特征
表 2.8 优秀理论四特征。
L3|L3|L3
特征 & 含义 & 自检问题
解释力 & 能解释已观察到的现象 & “这个理论能解释我观察到的金融现象吗?”
预测力 & 能预测尚未观察到的现象 & “基于这个理论,我能预测一个还没验证的结论吗?”
简洁性(parsimony) & 用最少的构念解释最多的现象 & “我的理论框架是不是太复杂了?能精简吗?”
可证伪性 & 能被数据推翻 & “有没有可能存在一组数据证明我的假设是错的?”\
[提示] 如果一个理论“不能被证伪”,那它就不是科学理论。例如“股价涨跌取决于市场情绪”——如果“市场情绪”没有独立于股价的测量方式,这个命题就不可证伪。
理论化的三种方法
表 2.9 理论化的三种方法。
L4|L4|L4|L4
方法 & 路径 & 适用场景 & 本手册对应章节
归纳法 & 从案例/数据中“涌现”理论 & 新兴领域、现有理论解释不了的现象 & 第 10 章(案例研究)
演绎法 & 从已有理论推导新命题并检验 & 理论成熟领域、竞争性理论需要仲裁 & 第 9 章(实证回归)
溯因法(Abduction) & 观察到意外现象→推测“最佳解释” & 遇到反常结果时 & 贯穿全手册\
第四种方法:类推法——发现新旧情境的结构相似性,将已有理论迁移到新领域。例如 Markus(1987)将“核爆炸链式反应”类推到“网络用户增长”,提出临界物质理论。在金融领域,将“传染病模型”类推到“金融危机传染”也是同样的思路。
金融学两大经典理论选读
1. 期望理论(Prospect Theory)
提出者:Kahneman & Tversky(1979),2002 年诺贝尔经济学奖
核心构念:参考点、损失厌恶、概率加权
核心命题:
人们根据“相对于参考点的得失”做决策,而非绝对财富水平
损失的痛苦约为等量收益快乐的 2-2.5 倍(损失厌恶系数)
金融应用:
保险需求:农户为什么愿意支付高于期望损失的保费?→ 因为损失厌恶
处置效应:投资者为什么“卖盈持亏”?→ 因为不愿实现损失
行为金融:整个学科的理论基石之一
边界条件:适用于个人决策情境;对机构投资者(如基金经理)的解释力较弱
2. 代理理论(Agency Theory)
提出者:Jensen & Meckling(1976);Ross(1973)最早提出
核心构念:委托人、代理人、信息不对称、道德风险、逆向选择、代理成本
核心命题:
当委托人无法完全观测代理人行为时,代理人会追求自身利益
基于结果的契约(如股票期权)比基于行为的契约(如固定工资)更能缓解代理问题
金融应用:
公司治理:股权结构→管理层激励→企业绩效
银行监管:存款人(委托人)无法监督银行(代理人)的风险行为→需要存款保险+资本充足率监管
农村金融:合作社社员(委托人)与理事长(代理人)的代理问题
边界条件:假设人是利己且有限理性的;在强集体主义文化(如中国农村宗族社会)中可能弱化
模型 vs 理论
表 2.10 模型 vs 理论。
L3|L3|L3
& 理论 & 模型
功能 & 解释“为什么” & 表达“是什么关系”
形式 & 文字+逻辑 & 数学公式/图示/路径图
例子 & 资产定价理论(风险与收益的权衡逻辑) & CAPM:
§2.5 三大研究范式
三范式对照表
表 2.11 三范式对照表。
L6|L6|L6|L6|L6|L6
范式 & 哲学基础(本体论) & 认识论 & 典型方法 & 经济研究举例 & 本手册章节
功能主义(实证主义) & 客观实在可测量、社会有规律可循 & 客观、价值中立 & 回归分析/实验/大规模调查 & “数字金融→农户收入”的因果效应 & 第 9 章
诠释主义 & 社会现实由人的主观意义建构 & 主观理解、共情 & 案例研究/民族志/扎根理论/深度访谈 & “村镇银行如何一步步建立农户信任” & 第 10 章
批判主义 & 权力结构决定社会现实 & 解放与反思 & 话语分析/政治经济学/批判民族志 & “金融化如何加剧农村不平等” & 选修拓展\
关键洞察
范式“由于是隐晦的、假设性的及被认为理所当然的,因此通常难以识别”。但你必须识别它——因为同一个现象,不同范式的研究者会提出完全不同的问题:
表 2.12 关键洞察。
L2|L2
现象:“某村数字金融采用率低” &
功能主义者问 & “哪些因素(年龄/教育/收入/网络覆盖)显著影响采用率?效应量多大?”
诠释主义者问 & “村民如何理解数字金融?他们的意义建构过程是什么?”
批判主义者问 & “谁从数字金融排斥中获益?权力结构如何再生产这种不平等?”\
本讲义的主线定位
功能主义(实证) --- 第 5-9 章主线 ---> 定量回归、因果推断
       +
诠释主义(案例) --- 第 10 章 ---> 案例研究、编码、扎根理论
       =
   "双轨并行":你不需要选一个、丢一个
学生自定位练习
问自己三个问题:
你的研究问题更接近哪个范式?
如果你想回答“X 是否影响 Y、影响多大” → 功能主义
如果你想回答“这个过程是怎么发生的、参与者如何理解” → 诠释主义
如果你想回答“谁从中获益、权力结构如何运作” → 批判主义
你的学位类型暗示了什么?
金融专硕(MF):多为功能主义路线(实证分析 + 政策建议)
学术型硕士/博士:可选诠释路线(如多案例研究、扎根理论)
你的数据条件支持哪个范式?
有大规模面板数据 → 功能主义
能深入 2-3 个案例做访谈 → 诠释主义
两者都有 → 混合方法(Mixed Methods)
△ 注意:范式选择不是“哪个更高级”的问题,而是“哪个更适合你的研究问题”的问题。一个优秀的案例研究不比一个优秀的回归分析“低级”。
§2.6 国内研究脉络意识
为什么不能只引国外理论?
CSSCI 期刊审稿人期待看到的是:
你知道国际前沿在说什么(英文文献)
你知道国内学界在这个问题上做了什么(中文文献)
你的研究如何同时与国际和国内对话
纯粹搬一个国外理论(如 TAM 模型)来解释中国现象,而没有与国内研究对话 = 缺乏理论贡献。
国内金融/农经学派脉络速览
农村金融方向
表 2.13 国内金融/农经学派脉络速览。
L3|L3|L3
学者 & 核心贡献 & 代表文献
冯兴元 & “局部知识范式”——农村金融信息不对称的解决依赖社区内部局部知识 & 《中国农村观察》2004
何广文 & 合作金融理论——中国农村合作金融的制度逻辑 & 中国农业大学系列研究
邓衡山 & 合作社治理——“名实分离”现象(名义合作社 vs 实际运作) & 《社会学研究》
张号栋 & 农村信用社改革效率评估 & 农业经济问题系列\
金融发展方向
表 2.14 学者 / 核心贡献 / 代表文献速查表。
L3|L3|L3
学者 & 核心贡献 & 代表文献
林毅夫 & “最优金融结构”理论——金融结构应与实体经济结构匹配 & 《经济研究》多篇
白钦先 & “金融文化”与金融可持续发展 & 辽宁大学系列
张杰 & 中国金融制度的变迁逻辑——“国家主导型金融” & 《中国金融制度:结构、变迁与改革》
黄益平 & 金融抑制、利率市场化与数字金融 & 北大国发院系列\
数字金融方向
表 2.15 学者/机构 / 核心贡献速查表。
L2|L2
学者/机构 & 核心贡献
郭峰等(北京大学) & 编制“北京大学数字普惠金融指数”——国内数字金融研究最常用的代理变量
黄益平 & 数字金融如何缓解信息不对称、服务长尾群体
张勋等 & 数字金融与包容性增长的实证研究\
行动建议
文献回顾(第 3 章)时同时检索中英文:
英文:Google Scholar、Web of Science、SSRN
中文:知网(CNKI)、万方——用学校 VPN 或 WebVPN 访问
建立“理论谱系图”:
纵轴:时间线(1990→2000→2010→2020)
横轴:学派/视角
标注:每个节点的代表学者 + 核心命题 + 你的研究如何接入
在论文文献综述中体现双轨对话:
❌ 错误写法:“根据 TAM 模型(Davis 1989),感知有用性影响使用意愿。”(只有国外)
✅ 正确写法:“国际上,TAM 模型(Davis 1989)[6]预测了技术采用行为;国内方面,冯兴元(2004)[7]的局部知识范式进一步指出,农村金融技术采用的关键障碍并非技术本身,而是信息不对称的社区嵌入性。本研究整合两条线索……”
行动项:在你的
research_question.md末尾,加一栏“初步理论对话对象”——列出 1-2 个国外理论 + 1-2 个国内学者/学派。
三方向副例:从现象到构念的操作化
【农】农村金融与微型金融
现象:“村里用移动支付的人越来越多了”
→ 研究问题(How 型):数字金融使用如何影响农户的正规信贷可得性?
→ 分析单元:农户个体(家庭层面)
→ 构念:
金融排斥(农户被排除在正规金融服务之外的状态)
数字鸿沟(不同群体获取数字技术的差异)
信贷可得性(获得正规贷款的难易程度)
→ 变量:
表 2.16 【农】农村金融与微型金融。
L3|L3|L3
构念 & 操作化变量 & 测量方式
金融排斥 & 是否有手机银行账户 & 问卷:0/1
数字鸿沟 & 移动支付使用频率 & 问卷:1-5 量表
信贷可得性 & 最近一年是否获得正规贷款 & 问卷:0/1 + 金额\
→ 理论:金融排斥理论(Sinclair 1967)+ 信息不对称理论(Stiglitz & Weiss 1981)——数字足迹可替代抵押品缓解逆向选择
【险】风险管理与保险
现象:“很多农户买了农业保险但其实不太理解保什么”
→ 研究问题(Why 型):为什么农户在风险认知不足的情况下仍购买农业保险?
→ 分析单元:农户个体
→ 构念:
风险厌恶(对不确定损失的规避倾向)
风险认知(对灾害发生概率和影响的主观判断)
投保意愿(实际购买保险的决策倾向)
→ 变量:
表 2.17 【险】风险管理与保险。
L3|L3|L3
构念 & 操作化变量 & 测量方式
风险厌恶 & 风险投资金额占总资产比例 & 问卷/账户数据
风险认知 & 自评风险认知量表 & Likert 1-5
投保意愿 & 是否投保(当年) & 保单数据:0/1\
→ 理论:期望理论(Kahneman & Tversky 1979,损失厌恶驱动投保)+ 社会学习理论(Bandura 1977,邻里效应——“隔壁老王买了我也买”)
【金】金融理论与政策
现象:“LPR 降了但小微企业贷款利率没怎么降”
→ 研究问题(Why 型):货币政策利率传导为何在小微企业端受阻?
→ 分析单元:商业银行(组织层面)
→ 构念:
信贷渠道(货币政策通过银行信贷供给影响实体经济的传导路径)
利率传导效率(政策利率变动传递到贷款利率的速度和幅度)
风险定价(银行对不同风险等级客户的差异化定价)
→ 变量:
表 2.18 【金】金融理论与政策。
L3|L3|L3
构念 & 操作化变量 & 测量方式
信贷渠道 & 小微企业贷款增速 & 银保监会数据
利率传导效率 & LPR 变动幅度 vs 贷款利率变动幅度 & 回归系数
风险定价 & 小微企业不良率 & 银行年报\
→ 理论:货币政策传导理论——信贷渠道(Bernanke & Gertler 1995)vs 利率渠道 + 银行风险承担渠道(Borio & Zhu 2012)
🛠 AI 辅助研究栏|用法一:现象→研究问题头脑风暴
场景:你有一个模糊的观察,但不知道怎么“学术化”它。
提示词模板:
AI 输出示例(假设现象 = “村里用移动支付的人越来越多”):
表 2.19 研究问题 / 类型 / 分析单元速查表。
L6|L6|L6|L6|L6|L6
# & 研究问题 & 类型 & 分析单元 & 核心构念 & 范式
1 & 移动支付普及对农户储蓄行为有何影响? & What & 个体 & 储蓄行为、支付便利 & 功能主义
2 & 为什么部分农户拒绝使用移动支付? & Why & 个体 & 技术接受、信任 & 诠释主义
3 & 移动支付如何通过信贷渠道影响农户收入? & How & 个体 & 信贷可得性、数字足迹 & 功能主义
… & … & … & … & … & …\
△ 注意:AI 生成的问题只是“头脑风暴”——你必须用以下标准筛选:
✅ 可证伪(能用数据检验)
✅ 有理论对话(不是凭空提问)
✅ 数据可得(你能拿到数据)
✅ 能力圈内(你的计量方法能驾驭)
用法二:mermaid 理论构图
场景:你已经确定了 3-5 个核心构念,想画出它们之间的理论关系图。
提示词模板:
AI 可能的输出:
graph LR
    A[金融素养<br/>自变量] -->|Lusardi & Mitchell 2014| B[储蓄行为<br/>中介变量]
    B -->|生命周期假说 Modigliani 1986| C[退休准备<br/>因变量]
    A -->|信息处理能力| D[投资决策<br/>中介变量]
    D -->|资产组合理论 Markowitz 1952| C
E[年龄] -.->|调节变量| A关键把关步骤(对应诚信检查点 S2.1):
逐条箭头核查——每条关系必须能找到一篇已发表论文或教材章节作为理论依据
找不到的箭头 = AI 可能虚构(hallucination)→ 删除或降级为“待验证”虚线
核查方法:用 Zotero 或 Google Scholar 搜索“作者 年份”确认论文存在且确实论证了该关系
用法三:概念辨析
场景:写文献综述前,你需要厘清两个相似概念的区别。
提示词模板:
示例:
AI 可能会告诉你:
金融素养(Financial Literacy):侧重“知识”维度——是否了解利率、通胀、风险分散等概念(Lusardi & Mitchell 2014)
金融能力(Financial Capability):侧重“行为”维度——是否能做出正确的金融决策并执行(Birkenmaier & Sherraden 2016)
结论:不是同一构念。前者测知识,后者测行为。
用途:写文献综述前厘清概念边界,避免在论文中混用不同构念。
🛡 AI 诚信栏|S2.1 AI 辅助理论构图不虚构理论关系
红线:AI 生成的理论框架图中,每条因果箭头(A→B)必须有真实文献支撑。没有文献支撑的箭头 = 学术虚构。
为什么这条红线如此重要?
AI 擅长“编造看似合理的理论关系”——这是 hallucination 的高级形态。它不会告诉你“我在编”,它生成的内容看起来逻辑通顺、格式规范
如果你的理论框架图中有一条虚构关系,后续整篇论文的假设推导都建立在错误基础上
审稿人一旦发现“引用文献不支持该假设”,直接拒稿,且会怀疑你其他引用的可靠性
检查方法(三步核实法)
Step 1:AI 画完理论图后,逐条箭头问自己——
        "这个关系出自哪篇论文?作者是谁?哪年发的?"

Step 2:用 Zotero 或 Google Scholar 检索确认——
        ① 该论文真实存在(不是 AI 编造的文献)
        ② 该论文确实论证了这条关系(不是张冠李戴)

Step 3:根据核实结果分类——
        [v] 核实通过 -> 保留,在图中标注"作者 年份"
        [!] 论文存在但未直接论证该关系 -> 降级为虚线,标注"推测"
        [x] 找不到论文 -> 删除该箭头
正确姿势
表 2.20 用法三:概念辨析。
L3|L3|L3
步骤 & 你的角色 & AI 的角色
1 & 列出核心构念 & 帮你画初版理论图
2 & 逐箭头核实文献 & 无法核实——它可能虚构
3 & 决定保留/降级/删除 & 按你的指令修改
4 & 最终确认理论图 & 排版美化\
核心原则:AI 画图,你核实。核实通过才能用。
检验标准
完成理论图后,用“优秀理论四特征”自检:
解释力:你的理论图能解释你观察到的现象吗?
预测力:基于这个图,你能预测一个尚未验证的结论吗?
简洁性:图中有没有多余的构念或箭头?能精简吗?
可证伪性:有没有可能存在数据推翻你的某条假设?(如果不可能被推翻→你的假设写得不够具体)
本章产出物:research_question.md
完成本章学习后,请建立你的研究问题卡。这是你整本手册的“种子文件”——后续每一章都会在此基础上迭代。
模板
# 研究问题卡(Research Question Card)

## 1. 现象描述
(用 2-3 句话描述你观察到的现象。要求:具体、可感知、有细节。
  [x] "农村金融发展不平衡"——太抽象
  [v] "我老家四川XX村,2023年新开了两家手机银行代理点,但60岁以上老人几乎没人用"——具体)

## 2. 研究问题
(用一句话提出你的核心问题。要求:包含明确的自变量和因变量,
  可以用"X 如何影响 Y"或"X 与 Y 之间是否存在因果关系"的句式。
  [x] "农村金融为什么发展不好"——太宽泛,无法操作化
  [v] "手机银行代理点的设立是否提高了 60 岁以上农村老人的金融参与度?"——可操作)

## 3. 初步假设
- H1(核心假设):[用一句话表述,如"代理点设立后,60 岁以上老人
    月均金融交易次数显著增加"]
- H2(机制假设):[如"该效应在距离最近银行网点 > 5 公里的村庄更强"]
- 对立假设 H0:[如"代理点对老人金融参与度无显著影响"]

## 4. 变量与数据
- 因变量 Y:[如"月均金融交易次数(转账/缴费/取款)"]
- 核心自变量 X:[如"本村是否设有手机银行代理点(0/1)"]
- 控制变量:[如"年龄、教育年限、距最近银行距离、家庭收入"]
- 数据来源:[ ] 公开数据库(哪个?)[ ] 需问卷调查 [ ] 需访谈 [ ] 不确定

## 5. 初步研究设计
- 方法:[ ] OLS 回归 [ ] 工具变量(IV)[ ] 双重差分(DID)
         [ ] 断点回归(RDD)[ ] 描述性统计 [ ] 案例研究
- 数据可得性:[ ] 公开数据库(哪个?)[ ] 需问卷调查 [ ] 需访谈 [ ] 不确定
- 能力圈:[ ] 计量方法可驾驭 [ ] 需学习新方法(哪个?)[ ] 超出能力
- 时间:[ ] 一学期可完成 [ ] 需要更长时间 [ ] 不确定
使用说明
English Edition
Chapter 2 · Thinking Like a Researcher: Science, Constructs, and Theory
Learning Objectives
After completing this chapter, you should be able to:
Use the induction–deduction loop to locate a concrete study (e.g., the Diamond–Dybvig 1983[8] bank-run model) on one of the two arcs
Distinguish concept / construct / variable, with one finance example at each layer
Refine a life observation (e.g., “more people in my village use mobile payment now”) into a research question (What/Why/How forms)
Sketch a “construct → variable → hypothesis” theory diagram (AI-assisted mermaid + human vetting)
State the three research paradigms (positivist / interpretive / critical) and which fits your topic
[Takeaway] This chapter involves no code and no regressions—it trains your ability to think a problem through. Many students tear up their theses halfway through; the root cause is usually a weak job on this chapter.
§2.1 The Two Pillars of Science: The Induction–Deduction Cycle
What Is Induction?
Definition: discover patterns from concrete observations, then distill them into theory. The direction is “bottom-up”.
A finance example:
Observation: you collect the NPL ratios of 10 village-and-township banks in Sichuan and find they all run significantly higher than large commercial banks in the same cities
Induction: “small banks have weaker risk control than large banks”
Theory building: the size–risk hypothesis (smaller bank → underinvestment in risk-control systems → higher NPL ratio)
Inductive research is also called “theory-building research”—the researcher constructs theoretical concepts and their patterns from observed data.
What Is Deduction?
Definition: start from an existing theory, derive testable hypotheses, then check them with data. The direction is “top-down”.
A finance example:
Theory: agency theory (Jensen & Meckling 1976[9]) predicts “the more dispersed the ownership, the more room for managerial shirking”
Derived hypothesis: ownership concentration correlates positively with the largest shareholder’s stake, and positively with ROA
Data: download listed-firm data from CSMAR and run panel regressions to test
Deductive research is also called “theory-testing research”—empirical data are used to test the concepts and models of existing theories.
The Induction–Deduction Loop
        +------- induction -------+
        |                         |
  theory/proposition <------- observation/data
        |                         ^
        |                         |
        +------- deduction -------+
             (hypothesis -> test)
A Classic Case: The Diamond–Dybvig (1983) Bank-Run Model
One of the most celebrated theory papers in finance (2022 Nobel Memorial Prize), it perfectly illustrates the induction–deduction cycle:
Table 2.1 The Diamond–Dybvig (1983) bank-run model.
L2|L2
Phase & Content
Inductive arc & Diamond and Dybvig observed recurring bank runs through history (the 1930s Great Depression, financial crises worldwide) and distilled a core insight: a bank run may be a “self-fulfilling prophecy”—depositors rush to withdraw because they fear others will withdraw first
Deductive arc & From the “demand-deposit contract + coordination failure” framework, two key predictions follow: (1) deposit insurance prevents runs (it removes the incentive to rush); (2) suspension of convertibility also prevents runs
Later validation & A large empirical literature tested the model’s predictions with FDIC data and cross-country variation in deposit insurance (e.g., Demirgüç-Kunt & Detragiache 2002)\
Primary Sources and Further Reading (GB/T 7714—2025)
【The seminal paper】
- DIAMOND D W, DYBVIG P H. Bank runs, deposit insurance, and liquidity[J]. Journal of Political Economy, 1983, 91(3): 401–419. DOI: 10.1086/261155. Full text online (open access): https://www.journals.uchicago.edu/doi/10.1086/261155; preprint PDF: https://www.bu.edu/econ/files/2012/01/DD83jpe.pdf
【Representative follow-up views (chronological)】
GORTON G. Banking panics and business cycles[J]. Oxford Economic Papers, 1988, 40(4): 751–781. Online: https://academic.oup.com/oep/article-abstract/40/4/751/2362190; JSTOR backup: https://www.jstor.org/stable/2662350.
View: using US banking panics from the late 19th to early 20th century as the sample, argues that “panics stem from depositors’ collective misjudgment of bank asset quality under information asymmetry,” supplying historical evidence for the Diamond–Dybvig model.CALOMIRIS C W, GORTON G. The origins of banking panics: models, facts, and bank regulation[M]//HUBBARD R G. Financial Markets and Financial Crises. Chicago: University of Chicago Press, 1991: 109–173. NBER chapter PDF (open access): https://www.nber.org/system/files/chapters/c11484/c11484.pdf.
View: links the pure Diamond–Dybvig model to the NBER financial-history database; using US bank-failure data from 1873–1933 it estimates “run-triggering thresholds” and finds that deposit insurance (FDIC) did drive run probability to zero.DIAMOND D W. Liquidity, banks, and markets[J]. Journal of Political Economy, 1997, 105(5): 928–956. DOI: 10.1086/262099. Online: https://www.journals.uchicago.edu/doi/abs/10.1086/262099.
View: Diamond extends his own model, showing that when markets and banks coexist, intertemporal trading frictions yield an optimal contractual division of labor—“short-term debt + banks”: markets handle hedging, banks handle intertemporal smoothing.ALLEN F, GALE D. Financial contagion[J]. Journal of Political Economy, 2000, 108(1): 1–33. DOI: 10.1086/262109. Online: https://www.journals.uchicago.edu/doi/10.1086/262109.
View: extends the single-bank run to systemic crises under interbank linkages—regional banks form “return correlations” through common asset holdings, so a shock in one region propagates to others via asset prices (an important theoretical basis for the 2008 crisis).GOLDSTEIN I, PAUZNER A. Demand-deposit contracts and the probability of bank runs[J]. Journal of Finance, 2005, 60(3): 1293–1327. DOI: 10.1111/j.1540-6261.2005.00762.x. Online: https://onlinelibrary.wiley.com/doi/abs/10.1111/j.1540-6261.2005.00762.x; Wharton preprint: https://finance.wharton.upenn.edu/~itayg/Files/bankruns-published.pdf.
View: adds global games techniques to the Diamond–Dybvig framework and derives an exact probability formula for runs—depositors’ “withdrawal decisions” hinge on threshold beliefs about others, and the effectiveness of deposit insurance depends on the design of those thresholds.CHEN Q, GOLDSTEIN I, JIANG W. Payoff complementarities and financial fragility: evidence from mutual fund outflows[J]. Journal of Financial Economics, 2010, 97(2): 239–262. DOI: 10.1016/j.jfineco.2010.04.002. Online: https://www.sciencedirect.com/science/article/abs/pii/S0304405X10000759.
View: tests “payoff complementarity → financial fragility” with a 1993–2005 panel of US mutual funds—when a fund’s returns correlate highly with its peers, the probability of forced fire sales under redemption shocks rises significantly, extending Diamond–Dybvig from banks to all “deposit-like” asset management.
➤Reading-order tip for MF/MSc students: read in the sequence “Diamond–Dybvig 1983 → Gorton 1988 / Calomiris-Gorton 1991 (historical validation) → Diamond 1997 (theoretical extension) → Allen-Gale 2000 / Goldstein-Pauzner 2005 (model deepening) → Chen-Goldstein-Jiang 2010 (empirical migration)”—a complete evidence chain from pure theory to the full panorama of financial fragility.
What This Means for You
Most empirical finance papers take the deductive route: theory → hypothesis → data → regression → conclusion. This is the main line of Chapter 9
Top theoretical innovations usually come from induction: observe a new phenomenon → distill a new theory. This is the route of Chapter 10’s case research
Their spiral relationship: in emerging fields where theory and explanations are scarce (e.g., digital finance as it emerged in 2013), inductive research is more valuable; in mature fields with multiple competing theories (e.g., capital structure), deductive research is more effective
§2.2 Unit of Analysis
Why the Unit of Analysis Matters So Much
The unit of analysis determines three things:
Where the data come from (Chapter 5)
At what level variables are measured (Chapter 5)
Which analytical methods apply (Chapter 9)
Choosing the wrong unit is like laying a crooked foundation—everything built on it is wasted.
Four Levels of Analysis
Table 2.2 Four levels of analysis.
L4|L4|L4|L4
Level & Meaning & Economics examples & Typical data sources
Individual & A single person / household & Farm households’ borrowing decisions, investor risk appetite, consumers’ financial literacy & Questionnaire surveys, door-to-door interviews
Group & People sharing a trait & All farmers in a village, a class of investors, rural women in a province & Group statistics, focus groups
Organization & Firms / institutions & Commercial bank efficiency, insurer solvency, cooperative governance & Annual reports, regulatory data, CSMAR
Society / system & Industry / region / nation & Provincial financial-development gaps, banking concentration, national financial deepening & Statistical yearbooks, World Bank WDI\
Figure 2.1 The four-level pyramid—individual → organization → industry → nation; note the ecological-fallacy warning at the base.
! The Ecological Fallacy—The Most Common Mistake
What is the ecological fallacy? Using higher-level (group) data to infer lower-level (individual) behavior.
Typical errors in economics research:
Table 2.3 The ecological fallacy—typical errors.
L2|L2
Practice & Problem
Using the county-level PKU digital finance index to infer “the probability that a given farmer uses digital finance” & ❌ The county index is an average over everyone in the county—it represents no specific farmer
Using provincial GDP growth to infer “every bank in the province is expanding” & ❌ The provincial average may conceal individual banks shrinking
Using an industry-average ROA to infer “every firm is profitable” & ❌ Averages conceal distributions\
The correct approach:
If your research question is whether individual farmers use digital finance, the unit of analysis = the farmer → you must collect household-level data (questionnaires)
If the question is whether farmers in counties with higher digital-finance development earn more, the unit = the county → county-level panel data suffice
The reverse error (exceptional fallacy / hasty generalization): inferring a general law from a single case, e.g., “I know someone who made money in stocks, so stocks always pay”—academically this is “selection bias”.
The Decision Frame
After you settle on a research question, ask yourself:
1. Whose behavior is my research question about? -> fix the unit of analysis
2. At what level are my data measured?            -> check the match
3. If they do not match -> change the question or change the data level
Action item: your
research_question.mdmust state explicitly “unit of analysis = ___”. This is not optional—it anchors every later method choice.
§2.3 Concepts, Constructs, and Variables
The Three Layers
Table 2.4 The three layers distinguished.
L4|L4|L4|L4
Layer & Definition & Features & Finance examples
Concept & A shared label in everyday communication & Vague, polysemous, no strict boundary & “financial literacy”, “risk”, “credit”, “being short of money”
Construct & An abstract concept deliberately created (or chosen) for research & Has a theoretical definition, not directly observable, needs operationalization & “financial literacy level”, “degree of risk aversion”, “credit accessibility”
Variable & The measurable operational expression of a construct & Takes values, quantifiable, can enter a regression & “Lusardi three-question score (0–3)”, “share of risky investment”, “access to formal credit (0/1)”\
The Key Insight
In other words—constructs are the researcher’s tools; they do not exist in nature. You must “forge” them for your research purpose.
Science needs operational definitions, not dictionary definitions. Dictionary definitions circle through synonyms (“an attitude is a feeling; a feeling is an attitude”), which is useless for research. An operational definition answers: how do you plan to measure it?
Worked Operationalization Chains
Chain 1: the farmer “lacks money”
Concept:   "the farmer lacks money" (everyday language, vague)
  v  theorize
Construct: "financial exclusion" (academic definition: the state of
           being unable to access formal financial services)
  v  operationalize
Variable 1: has a formal bank account (0/1)
Variable 2: number of formal loans in the past year (count)
Variable 3: distance to the nearest bank branch (km)
Chain 2: this person “understands finance”
Concept:   "this person understands finance" (everyday language)
  v  theorize
Construct: "financial literacy" (Lusardi & Mitchell 2014: the ability
           to make effective financial decisions)
  v  operationalize
Variable:  Lusardi three-question score (0--3)
  - interest-rate question (compound interest)
  - inflation question (purchasing power)
  - diversification question (don't put all eggs in one basket)
Figure 2.2 The concept → construct → variable chain—using “corporate governance → board independence → share of independent directors” as the example.
Propositions and Hypotheses
Table 2.5 Propositions vs. hypotheses.
L3|L3|L3
& Proposition & Hypothesis
Level & Theoretical & Empirical
Object & Relations between constructs & Relations between variables
Directly testable? & No—tested indirectly through hypotheses & Yes—tested directly with data
Example & “The higher the financial literacy, the higher the household saving rate” & “Each additional point on the Lusardi score raises the household saving rate by 2.3 percentage points”\
The move from proposition to hypothesis = operationalization, detailed in Chapter 5.
! The Most Common “Fatal Flaw” in Theses
Typical cases:
The research question says “digital financial literacy”, but the questionnaire measures “frequency of mobile-phone use”—not the same thing
The question says “farmers’ risk aversion”, but the proxy is “whether they bought insurance”—insurance purchase also depends on income, information, and channels; it is not equivalent to risk aversion
The antidote: when writing the research question, simultaneously list “which variable will measure this construct”, and check the literature for how others measured it (a core task of Chapter 3’s literature review).
Variable Types at a Glance (Deepened in Chapter 9)
Table 2.6 Variable types at a glance.
L3|L3|L3
Type & Role & Finance example
Independent (IV) & Cause / explainer & Degree of digital finance use
Dependent (DV) & Outcome / explained & Farm household income growth
Mediator & Transmission mechanism & Credit accessibility (digital finance → credit access → income)
Moderator & Strengthens/weakens IV→DV & Age (stronger digital-finance effect among the young?)
Control & Rules out confounds & Region, years of schooling, household size\
§2.4 Theories and Models
The Four Building Blocks of Theory
Whetten’s (1989) classic framework:
Table 2.7 The four building blocks of theory.
L3|L3|L3
Block & Question answered & Finance example (agency theory)
Constructs & What is the theory “about”? & Principal, agent, information asymmetry, moral hazard
Propositions & How are constructs “related”? & Information asymmetry
Logic / mechanism & “Why” this relation? & The principal cannot fully observe the agent, so the agent has an incentive to shirk
Boundary conditions & “Under what conditions” does it hold? & Applies to organizations with clear principal–agent relations (firms, banks), not to the fully self-employed\
Four Marks of a Good Theory
Table 2.8 Four marks of a good theory.
L3|L3|L3
Mark & Meaning & Self-check question
Explanatory power & Explains observed phenomena & “Can this theory explain the financial phenomenon I observe?”
Predictive power & Predicts unobserved phenomena & “From this theory, can I predict a conclusion not yet tested?”
Parsimony & Explains much with few constructs & “Is my theoretical framework too complex? Can it be simplified?”
Falsifiability & Can be refuted by data & “Could any dataset prove my hypothesis wrong?”\
[Takeaway] A theory that “cannot be falsified” is not scientific. Example: “stock prices move on market sentiment”—if “sentiment” has no measurement independent of prices, the proposition is unfalsifiable.
Three Modes of Theorizing
Table 2.9 Three modes of theorizing.
L4|L4|L4|L4
Mode & Route & When to use & Handbook chapter
Induction & Theory “emerges” from cases/data & Emerging fields; phenomena existing theory cannot explain & Ch. 10 (case research)
Deduction & Derive and test new propositions from existing theory & Mature fields; competing theories need adjudication & Ch. 9 (empirical regressions)
Abduction & Observe a surprise → infer the “best explanation” & When results run counter to expectations & Throughout\
A fourth mode: analogy—spot structural similarity between old and new settings and migrate a theory. Markus (1987) analogized “nuclear chain reactions” to “network user growth”, yielding critical-mass theory. In finance, mapping “epidemic models” onto “financial contagion” follows the same logic.
Two Classic Finance Theories
1. Prospect Theory
Proposed by: Kahneman & Tversky (1979); 2002 Nobel Memorial Prize
Core constructs: reference point, loss aversion, probability weighting
Core propositions:
People decide on “gains and losses relative to a reference point”, not absolute wealth
The pain of a loss is roughly 2–2.5 times the pleasure of an equivalent gain (the loss-aversion coefficient)
Finance applications:
Insurance demand: why do farmers pay premia above expected losses? → loss aversion
Disposition effect: why do investors “sell winners and ride losers”? → reluctance to realize losses
Behavioral finance: one of the field’s theoretical cornerstones
Boundary conditions: fits individual decision contexts; explains institutional investors (e.g., fund managers) less well
2. Agency Theory
Proposed by: Jensen & Meckling (1976); the idea traces back to Ross (1973)
Core constructs: principal, agent, information asymmetry, moral hazard, adverse selection, agency costs
Core propositions:
When principals cannot fully observe agents, agents pursue their own interests
Outcome-based contracts (e.g., stock options) mitigate agency problems better than behavior-based contracts (e.g., fixed wages)
Finance applications:
Corporate governance: ownership structure → managerial incentives → firm performance
Bank regulation: depositors (principals) cannot monitor banks’ (agents’) risk-taking → deposit insurance plus capital-adequacy regulation
Rural finance: the agency problem between cooperative members (principals) and the cooperative director (agent)
Boundary conditions: assumes self-interested, boundedly rational people; may weaken in strongly collectivist cultures (e.g., clan-based rural China)
Models vs. Theories
Table 2.10 Models vs. theories.
L3|L3|L3
& Theory & Model
Function & Explains “why” & Expresses “what relates to what”
Form & Words + logic & Mathematical formulas / diagrams / path charts
Example & Asset pricing theory (the risk–return trade-off logic) & CAPM:
§2.5 The Three Research Paradigms
The Three Paradigms Compared
Table 2.11 The three research paradigms.
L6|L6|L6|L6|L6|L6
Paradigm & Philosophical basis (ontology) & Epistemology & Typical methods & Economics example & Handbook chapter
Functionalism (positivism) & An objective reality is measurable; society follows laws & Objective, value-neutral & Regression / experiments / large-scale surveys & The causal effect of “digital finance → farm income” & Ch. 9
Interpretivism & Social reality is constructed through subjective meanings & Subjective understanding, empathy & Case studies / ethnography / grounded theory / in-depth interviews & “How do village banks win farmers’ trust, step by step?” & Ch. 10
Critical theory & Power structures shape social reality & Emancipation and reflection & Discourse analysis / political economy / critical ethnography & “How does financialization deepen rural inequality?” & Elective extension\
The Key Insight
Paradigms “are usually hard to identify because they are implicit, taken for granted”. But you must identify yours—because on the same phenomenon, researchers in different paradigms ask entirely different questions:
Table 2.12 One phenomenon, three paradigms.
L2|L2
Phenomenon: “low digital-finance adoption in village X” &
The functionalist asks & “Which factors (age / education / income / network coverage) significantly affect adoption? How large are the effects?”
The interpretivist asks & “How do villagers understand digital finance? What is their process of meaning-making?”
The critical theorist asks & “Who benefits from digital financial exclusion? How do power structures reproduce this inequality?”\
Where This Handbook Stands
Functionalism (positivist) --- main line of Ch. 5-9 ---> regressions, causal inference
       +
Interpretivism (cases)    --- Ch. 10          ---> case studies, coding, grounded theory
       =
   "dual tracks": you need not pick one and drop the other
Self-Positioning Exercise
Ask yourself three questions:
Which paradigm is closer to your research question?
If you want to answer “does X affect Y, and by how much” → functionalism
If you want to answer “how does the process unfold, how do participants understand it” → interpretivism
If you want to answer “who benefits, how do power structures operate” → critical theory
What does your degree type suggest?
Master of Finance (MF): mostly the functionalist route (empirical analysis + policy advice)
Academic master’s / PhD: the interpretive route is available (multi-case studies, grounded theory)
Which paradigm do your data conditions support?
Large panel data available → functionalism
Deep interviews in 2–3 cases possible → interpretivism
Both → mixed methods
△ Note: choosing a paradigm is not about “which is more advanced” but “which fits your question”. An excellent case study is not “inferior” to an excellent regression.
§2.6 Awareness of the Domestic Research Landscape
Why Citing Foreign Theory Alone Is Not Enough
CSSCI reviewers expect to see:
That you know what the international frontier is saying (English literature)
That you know what domestic scholarship has done on the question (Chinese literature)
How your study converses both internationally and domestically
Importing a foreign theory (e.g., the TAM model) to explain a Chinese phenomenon without engaging domestic research = a lack of theoretical contribution.
A Quick Map of Domestic Finance / Agricultural Economics Schools
Rural Finance
Table 2.13 Domestic rural finance scholars.
L3|L3|L3
Scholar & Core contribution & Representative work
Feng Xingyuan & The “local knowledge paradigm”—solving rural information asymmetry relies on community-embedded local knowledge & Chinese Rural Observations 2004
He Guangwen & Cooperative finance theory—the institutional logic of rural cooperative finance in China & Series of studies, China Agricultural University
Deng Hengshan & Cooperative governance—the “nominal vs. real separation” phenomenon (cooperatives in name vs. in operation) & Sociological Research
Zhang Haodong & Efficiency assessment of rural credit cooperative reform & Series in Issues in Agricultural Economy\
Finance and Development
Table 2.14 Domestic finance-and-development scholars.
L3|L3|L3
Scholar & Core contribution & Representative work
Lin Yifu & The “optimal financial structure” theory—financial structure should match the real-economy structure & Multiple papers in Economic Research Journal
Bai Qinxian & “Financial culture” and sustainable financial development & Series, Liaoning University
Zhang Jie & The logic of change in China’s financial system—“state-led finance” & China’s Financial System: Structure, Change and Reform
Huang Yiping & Financial repression, interest-rate liberalization, digital finance & Series, National School of Development, PKU\
Digital Finance
Table 2.15 Domestic digital finance scholars / institutions.
L2|L2
Scholar / institution & Core contribution
Guo Feng et al. (PKU) & Compiled the “Peking University Digital Financial Inclusion Index”—the most-used proxy in domestic digital finance research
Huang Yiping & How digital finance mitigates information asymmetry and serves the long tail
Zhang Xun et al. & Empirical studies of digital finance and inclusive growth\
Action Advice
Search both Chinese and English in your literature review (Ch. 3):
English: Google Scholar, Web of Science, SSRN
Chinese: CNKI, Wanfang—via your school VPN or WebVPN
Build a “theory genealogy chart”:
Vertical axis: timeline (1990 → 2000 → 2010 → 2020)
Horizontal axis: school / perspective
Annotations: representative scholar + core proposition + how your study plugs in
Show the two-track dialogue in your literature review:
❌ Wrong: “According to the TAM model (Davis 1989), perceived usefulness shapes usage intention.” (foreign only)
✅ Right: “Internationally, the TAM model (Davis 1989)[6] predicts technology adoption; domestically, Feng Xingyuan’s (2004)[7] local knowledge paradigm further suggests that the key barrier to rural technology adoption is not the technology itself but the community embeddedness of information asymmetry. This study integrates both threads…”
Action item: at the end of your
research_question.md, add a row “tentative theoretical dialogue partners”—list 1–2 foreign theories + 1–2 domestic scholars or schools.
Three-Track Worked Examples: From Phenomenon to Construct
【Agri】Rural Finance and Microfinance
Phenomenon: “more and more people in my village use mobile payment”
→ Research question (How form): How does digital finance use affect farm households’ access to formal credit?
→ Unit of analysis: the farm household (family level)
→ Constructs:
Financial exclusion (the state of being shut out of formal financial services)
Digital divide (differences across groups in access to digital technology)
Credit accessibility (how hard it is to obtain formal loans)
→ Variables:
Table 2.16 【Agri】rural finance: constructs and variables.
L3|L3|L3
Construct & Operationalized variable & Measurement
Financial exclusion & Has a mobile banking account & Questionnaire: 0/1
Digital divide & Frequency of mobile payment use & Questionnaire: 1–5 scale
Credit accessibility & Obtained a formal loan in the past year & Questionnaire: 0/1 + amount\
→ Theory: financial exclusion theory (Sinclair 1967) + information asymmetry (Stiglitz & Weiss 1981)—digital footprints can substitute for collateral and ease adverse selection
【Ins】Risk Management and Insurance
Phenomenon: “many farmers bought agricultural insurance without really understanding what it covers”
→ Research question (Why form): Why do farmers buy agricultural insurance despite weak risk awareness?
→ Unit of analysis: the farm household
→ Constructs:
Risk aversion (the tendency to avoid uncertain losses)
Risk perception (subjective judgment of hazard probability and impact)
Insurance uptake (the actual purchase decision)
→ Variables:
Table 2.17 【Ins】risk and insurance: constructs and variables.
L3|L3|L3
Construct & Operationalized variable & Measurement
Risk aversion & Risky investment as share of total assets & Questionnaire / account data
Risk perception & Self-rated risk-perception scale & Likert 1–5
Insurance uptake & Insured this year & Policy data: 0/1\
→ Theory: prospect theory (Kahneman & Tversky 1979—loss aversion drives insurance) + social learning theory (Bandura 1977—neighbor effects, “my neighbor bought, so I buy”)
【Fin】Finance Theory and Policy
Phenomenon: “LPR fell, but small and micro firms’ lending rates barely moved”
→ Research question (Why form): Why does monetary policy rate transmission stall at the small and micro firm end?
→ Unit of analysis: the commercial bank (organization level)
→ Constructs:
Credit channel (the path through which policy affects the real economy via bank credit supply)
Interest rate pass-through efficiency (the speed and magnitude with which policy rates reach lending rates)
Risk-based pricing (differentiated pricing across borrower risk classes)
→ Variables:
Table 2.18 【Fin】finance and policy: constructs and variables.
L3|L3|L3
Construct & Operationalized variable & Measurement
Credit channel & Growth of loans to small and micro firms & Regulator data
Rate pass-through & LPR change vs. lending-rate change & Regression coefficient
Risk-based pricing & Small/micro NPL ratio & Bank annual reports\
→ Theory: monetary transmission—credit channel (Bernanke & Gertler 1995) vs. interest rate channel + bank risk-taking channel (Borio & Zhu 2012)
🛠 AI-Assisted Research|Use 1: Brainstorming from Phenomenon to Research Question
Scenario: you have a fuzzy observation but do not know how to make it “academic”.
Prompt template:
Sample AI output (assume the phenomenon = “more and more people in my village use mobile payment”):
Table 2.19 Brainstormed questions / types / units.
L6|L6|L6|L6|L6|L6
# & Research question & Type & Unit & Core constructs & Paradigm
1 & How does mobile payment adoption affect farm households’ saving behavior? & What & Individual & Saving behavior, payment convenience & Functionalism
2 & Why do some farmers refuse mobile payment? & Why & Individual & Technology acceptance, trust & Interpretivism
3 & How does mobile payment affect farm income through the credit channel? & How & Individual & Credit accessibility, digital footprints & Functionalism
… & … & … & … & … & …\
△ Note: AI-generated questions are “brainstorming” only—you must screen them with these criteria:
✅ Falsifiable (testable with data)
✅ In theoretical dialogue (not asked from thin air)
✅ Data attainable (you can actually get the data)
✅ Within your competence (your econometric toolkit can handle it)
Use 2: mermaid Theory Diagrams
Scenario: you have settled on 3–5 core constructs and want to diagram their theoretical relations.
Prompt template:
Possible AI output:
graph LR
    A[Financial literacy<br/>IV] -->|Lusardi & Mitchell 2014| B[Saving behavior<br/>mediator]
    B -->|life-cycle hypothesis Modigliani 1986| C[Retirement prep<br/>DV]
    A -->|information processing| D[Investment decisions<br/>mediator]
    D -->|portfolio theory Markowitz 1952| C
    E[Age] -.->|moderator| A
Key vetting steps (integrity checkpoint S2.1):
Check every arrow—each relation must trace to a published paper or a textbook chapter
An arrow with no source may be an AI hallucination → delete it or downgrade it to a dashed “to be verified” line
How to check: search “author year” in Zotero or Google Scholar to confirm the paper exists and actually argues the relation
Use 3: Concept Discrimination
Scenario: before writing your literature review, you need to sort out two similar concepts.
Prompt template:
Example:
The AI may tell you:
Financial literacy: the “knowledge” dimension—do you understand interest, inflation, diversification? (Lusardi & Mitchell 2014)
Financial capability: the “behavior” dimension—can you make and execute sound financial decisions? (Birkenmaier & Sherraden 2016)
Verdict: not the same construct. The former measures knowledge, the latter behavior.
Use: clarify concept boundaries before the literature review, so the thesis never mixes different constructs.
🛡 AI Integrity|S2.1 AI-Assisted Theory Mapping Must Not Fabricate Theoretical Relations
The red line: in an AI-drawn theory framework, every causal arrow (A→B) must rest on real literature. An arrow without literature = academic fabrication.
Why this red line matters so much
AI excels at “inventing plausible theoretical relations”—hallucination in its most advanced form. It will not tell you “I am making this up”; its output looks logical and well formatted
If one relation in your framework is fabricated, the hypothesis derivation of the entire thesis rests on a wrong foundation
Once a reviewer finds “the cited literature does not support this hypothesis”, it is a desk reject—and every other citation becomes suspect
How to check (the three-step verification)
Step 1: after the AI draws the diagram, interrogate every arrow---
        "Which paper does this relation come from? Which author? What year?"

Step 2: confirm in Zotero or Google Scholar---
        (1) the paper really exists (not an AI-invented reference)
        (2) the paper really argues this relation (no misattribution)

Step 3: classify by verification result---
        [v] verified    -> keep, and label the arrow "author year"
        [!] exists but does not argue this -> downgrade to a dashed
            "speculative" line
        [x] no paper found -> delete the arrow
The correct division of labor
Table 2.20 Who does what in theory mapping.
L3|L3|L3
Step & Your role & AI’s role
1 & List the core constructs & Draft the first version of the diagram
2 & Verify every arrow against literature & Cannot verify—it may fabricate
3 & Decide keep / downgrade / delete & Revise per your instructions
4 & Final confirmation of the diagram & Typeset and beautify\
The core principle: the AI draws, you verify. Use it only after verification passes.
Acceptance test
After finishing the diagram, check it against the “four marks of a good theory”:
Explanatory power: does the diagram explain the phenomenon you observed?
Predictive power: from this diagram, can you predict a conclusion not yet tested?
Parsimony: any redundant constructs or arrows? Can it be simplified?
Falsifiability: could any data refute one of your hypotheses? (If nothing could, your hypotheses are not specific enough)
Chapter Deliverable: research_question.md
After finishing this chapter, build your research question card—the “seed file” of the whole handbook; every later chapter iterates on it.
Template
# Research Question Card

## 1. Phenomenon description
(Describe the phenomenon in 2-3 sentences. Requirements: concrete,
  perceptible, detailed.
  [x] "rural finance develops unevenly" -- too abstract
  [v] "in my home village XX, Sichuan, two mobile banking agents opened
      in 2023, but hardly anyone over 60 uses them" -- concrete)

## 2. Research question
(State your core question in one sentence. Requirements: an explicit
  IV and DV, phrased as "how does X affect Y" or "is there a causal
  relation between X and Y".
  [x] "why is rural finance underdeveloped" -- too broad to operationalize
  [v] "did the mobile banking agents raise financial participation among
      rural residents over 60?" -- operational)

## 3. Preliminary hypotheses
- H1 (core): [one sentence, e.g., "after the agents opened, average
    monthly financial transactions by residents 60+ rose significantly"]
- H2 (mechanism): [e.g., "the effect is stronger in villages farther
    than 5 km from a bank branch"]
- Null H0: [e.g., "the agents have no significant effect on elders'
    financial participation"]

## 4. Variables and data
- DV Y: [e.g., "average monthly financial transactions
    (transfers / bill payment / withdrawals)"]
- Core IV X: [e.g., "village has a mobile banking agent (0/1)"]
- Controls: [e.g., "age, years of schooling, distance to nearest bank,
    household income"]
- Data source: [ ] public database (which?) [ ] survey needed
    [ ] interviews needed [ ] unsure

## 5. Preliminary research design
- Method: [ ] OLS [ ] IV [ ] DID [ ] RDD [ ] descriptive stats
         [ ] case study
- Data attainability: [ ] public database (which?) [ ] survey needed
    [ ] interviews needed [ ] unsure
- Competence: [ ] methods I can handle [ ] need to learn (which?)
    [ ] beyond my ability
- Time: [ ] doable in one semester [ ] needs longer [ ] unsure